|
Software Development Magazine - Project Management, Programming, Software Testing |
|
Scrum Expert - Articles, tools, videos, news and other resources on Agile, Scrum and Kanban |
Testing Performance of Mobile Apps - Part 3: The Network
Newman Yang and Phil Hamilton, XBOSoft, www.xbosoft.com
Today more and more users access the web via mobile devices. What is the difference in accessing a web app or web site from a mobile platform versus a desktop? From a desktop, if more users visit a www.mycompany.com web site than it was designed for, there may be slow server response or the server may crash. But what about mobile access? One report from Fonolo [1] showed that 63% of online visitors would be less likely to do business with a company via any channel after having problems with transactions on a mobile device, so performance for mobile applications seems to have a significant impact not only on that particular transaction but also on the user's overall impression or experience and remembrance of that company and it's products or services.
When executing upload download speed test on a desktop, web, or client server platform, we commonly use tools such as LoadRunner, NeoLoad, LoadUI or Webload to emulate virtual users and simulate activities on the target web site or web app. These tools enable us to analyze each step or steps and potential scenarios where many users are executing different percentages of different activity sequences.
One common tool commonly used is Speedtest.net. This tool tests the user's current network situation. With a native mobile application for both Android and iOS, Speedtest.net executes tests from a local server depending on the location of your device.
Examining the measurements provided by SPEEDTEST:
- Ping time: This indicates the initial time to send a message and hear back from the application server. In some instances we call this first look or the initial reaction time of the network for the first packets to come back to the device through the network.
- Download speed: This is the speed of downloading data, so especially for browsing or information related mobile applications such as news or video, this measurement can significantly affect the user experience of performance.
- Upload speed: This is the speed of uploading data, so depending on the characteristics of the mobile application, this measurement can significantly affect the user experience of performance or not at all.
When carrying out network performance tests, as usual its important to have a controlled environment and systematic parameter alteration. Some of the parameters in the test environment for instance include: mobile device, mobile application (native or mobile web site), type of interaction, time of day, etc.
We used SPEEDTEST to carry out some simple network performance tests and get a comparison baseline. Firstly, we wanted to get some 3G network performance characteristics with one device, the HTC One (Android 4.1). We ran the test six times. Figure 1 shows the results.
Test cycle |
ping time (10ms) |
download speed (kbps) |
upload speed (kbps) |
1 |
41.1 |
26 |
13 |
2 |
70.3 |
61 |
151 |
3 |
17.700 |
32 |
48.000 |
4 |
25.6 |
33 |
100 |
5 |
23.1 |
98 |
66 |
6 |
44.1 |
29 |
22 |
StdDev |
19.300 |
28 |
52.000 |
Avg |
37 |
47 |
67 |
CV |
0.522 |
0.596 |
0.776 |
Figure 1: Network -3G, Device: HTC One (Android 4.1), 6 test cycles

Figure 2. Graphic: Network -3G, Device: HTC One (Android 4.1), 6 test cycles
You can see from Figure 2 that there is a high variation in the results between the test runs. In particular the coefficient of variation (CV-standard deviation/mean) are over 50% for all measurements. This indicates that 3G users experience extreme variation in their application performance when accessing the network especially for upload speed.
Next, we wanted to see how this varied in different networks while keeping other variables constant.
Test cycle |
ping time (10ms) |
download speed (kbps) |
upload speed (kbps) |
1 |
45.8 |
8 |
7 |
2 |
36.8 |
12 |
13 |
3 |
24.9 |
15 |
9 |
4 |
44.9 |
14 |
8 |
5 |
51.5 |
15 |
11 |
6 |
44.1 |
9 |
13 |
StdDev |
9.3 |
3 |
2.6 |
Mean |
41.3 |
12 |
10 |
CV |
0.225 |
0.250 |
0.260 |
Figure 3. Network -2G, Device: HTC One (Android 4.1), 6 times (test cycles)

Figure 4. Graphic: Network -2G, device: HTC One (Android 4.1), 6 times (test cycles)
As shown in Figure 3, notice that although the download speeds were significantly slower with 2G versus 3G, the variability of the results as shown in Figure 4 is less than half of 3G network results. So although the speed is slower, the variability may impact applications that have 'bursty' traffic such as games. Now let's look at the WIFI results.
Test cycle |
ping time (ms) |
download speed (kbps) |
upload speed (kbps) |
1 |
96.0 |
960.0 |
430.0 |
2 |
87.0 |
930.0 |
470.0 |
3 |
99.0 |
940.0 |
470.0 |
4 |
64.0 |
970.0 |
480.0 |
5 |
51.5 |
970.0 |
460.0 |
6 |
88.0 |
970.0 |
460.0 |
StdDev |
18.9 |
17.5 |
17.2 |
Avg |
80.9 |
957.0 |
462.0 |
CV |
0.234 |
0.018 |
0.037 |
Figure 5. Network -wifi, Device: HTC One (Android 4.1), 6 times (test cycles)
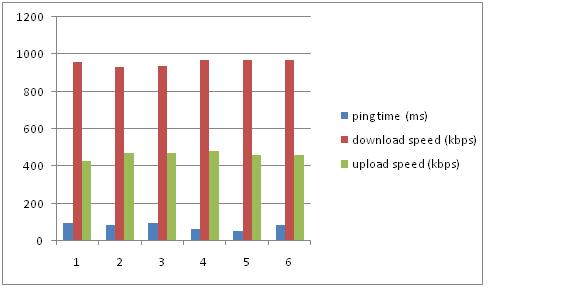
Figure 6. Graphic: Network -wifi, Device: HTC One (Android 4.1), 6 times (test cycles)
Just based on these simple tests, we can draw some conclusions. Yes, 3G is faster than 2G and of course WIFI is faster than 3G. But the real discovery here is the volatility and unstableness of the 3G network compared to 2G. Although it is significantly faster, the user experience may suffer due to its instability and performance variation. I often make this choice in my daily life. Do I take the subway which is slow, yet predictable and deterministic but knowing I'll get there in 45 minutes. Or, do I drive and take the risk of traffic where I might get there in 10 minutes, but it could also be 30 minutes with 20 minutes of added frustration. With still some users on 2G networks, many on 3G, and now some users on 4G, mobile application developers need to consider the performance variability when designing their application not only for timeouts but the overall architecture and UI features for the optimal user experience.
Figures 7 and 8 summarize the averages of our experiment for 2G, 3G, and WIFI networks.
|
Test Network |
ping time (ms) |
download speed (kbps) |
upload speed (kbps) |
|
2G |
413 |
12 |
10 |
|
3G |
370 |
46.5 |
67 |
|
Wifi |
81 |
957 |
462 |
Figure 7. Summary-Same device HTC One (Android 4.1), different network: 2G, 3G, Wifi (on average)
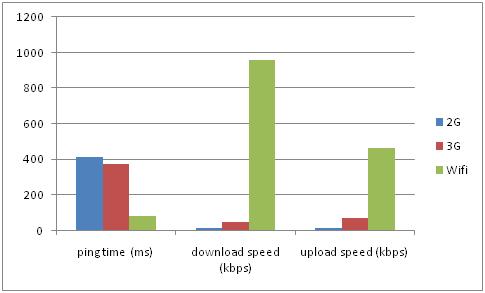
Figure 8. Graphic: Summary-Same device HTC One (Android 4.1), different network: 2G, 3G, Wifi (on average)
Obviously, different networks have different performance but the question is how the performance can influence user experience. Next we wanted to see how different device influence the user's experience of network performance. So we took the best performing network (WIFI) and tested it with 3 additional devices.
|
Devices |
ping time (ms) |
download speed (kbps) |
upload speed (kbps) |
|
HTC One (Android 4.1) |
94 |
965 |
450 |
|
iPhone4S (IOS 5.01) |
83 |
960 |
460 |
|
Motorola ME860 (Android 2.2) |
90 |
950 |
430 |
|
iPhone5 (IOS 6.0) |
88 |
960 |
450 |
Figure 9. Same network -WIFI, Different device: iPhone4S (iOS5.0), HTC One (Android4.1), Motorola ME860 (Android 2.2)
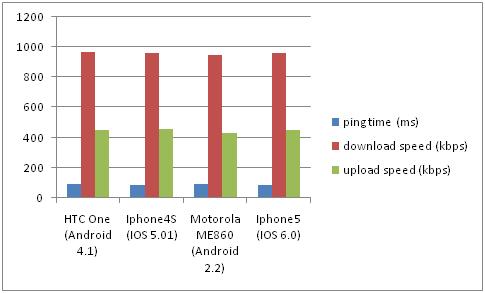
Figure 10. Graphic: Same network -WIFI, Different device: Iphone4S (iOS5.0), HTC One (Android4.1), Motorola ME860 (Android 2.2)
We can see it is very close. What is most interesting is that you often see advertisements for how fast a new smartphone is. Perhaps the phone does have great performance in that it allows users to swap between many applications quickly or that native mobile applications execute much faster than older model phones. But in reality, there are still many mobile applications that are web-based and not native applications. This means that much of the application's performance and user experience will be dependent on the network's performance and as we've shown, that can vary widely and is independent of the phone itself.
However, the network performance is still impacted by the application and the way it sends data over the network. Although our simple tests indicated that the device is not important regarding being influenced by network performance, different applications will send different data packet structures to the server and these data packet structures are also treated differently by the network. Before testing your application's load on different networks, it is still a good idea to investigate your users' device models as different device models will send different amounts of data, even for the same application or web site accessed. Figure 14 shows a market share as of 4Q 2012, but it differs between different products in different countries. For example, if your application or site is accesses mostly in a developing country, maybe the IOS percentage will lower than indicated by aggregated statistics as shown.
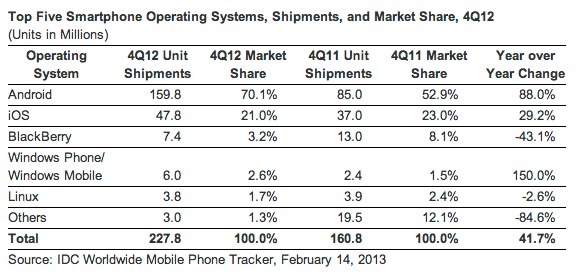
Figure 11. Smartphone OS shipment and market share
Device and Application effect on Network Performance
So given a particular device, if you just take into account pure network speed, it makes sense that the results would be close to identical as shown in Figures 9 and 10. However, what happens for the different devices but for the same application on an identical network. Does the application behave differently and display different performance characteristics with different devices even with the same network?
To investigate this, we loaded our own home page with 3 simulated devices using Mobitest, a tool developed by Akamai.
iPhone 4, iOS 5.0 |
Nexus S, Android 2.3 |
iPad 2, iOS 5.0 |
|
Load Time |
8.46s |
5.13s |
3.64s |
Bytes |
344.62kb |
263.88kb |
891.52kb |
Figure 12. Same application, same network, different device
So, what is interesting in this analysis is that our site can sense a mobile device, a phone, and take the user automatically to the mobile site. As you can see, the mobile site is optimized with a totally different application and different functionality and screen, thus the different amount of bytes loaded. What is notable is that even though the Android 2.3 phone and the iOS phone render the same site, m.xbosoft.com, their performance is significantly different. We ran this test many times with consistent results where the bytes transferred was about 30 percent more for the iPhone, and the load time was 30 to 50 percent faster for the Android device. This indicates that the application and device does have an impact on the network performance due to different packet sizes and thereby amount of data transferred by the particular device for that application.
Troubleshooting Poor Performance
So, once you do discover that there is a potential problem with an application on a particular device, and/or a particular you can dig deeper into the data being transferred. See our previous article on mobile server performance (http://www.methodsandtools.com/archive/mobileserverperformance.php). In the previous article, we discussed how load times of the data should be examined via content download metrics. However, you can dig deeper to discover further information that can help you troubleshoot based on network performance issues.
One way to dig deeper is to use a HAR (HTTP Archive) viewer. An HTTP Archive is a common format for recording HTTP tracing information. This file contains a record of each object being loaded and the time. Information contained includes:
- time to fetch the DNS information
- time each object takes to be requested
- time to connect to the server
- time to transfer from the server to the browser of each object
- whether an object is blocked
With a HAR viewer, you can examine these measurements in detail for each object. Looking at these measurements, our previous article focused on the time to transfer from the server to the browser of each object, hence download times in that article shown in Figure 8: Waterfall View of time of each object downloaded which can be partially solved by caching. However, other measurements such as time the object takes to be requested, and time to connect to the server are more indicative of poor network performance. To examine the data, the HAR file format can be read by many viewers, each with a different format and view of the data. The Mobitest tool has a built in viewer that enables us to look at particular images and http requests that could be causing the delays as shown in Figure 13.
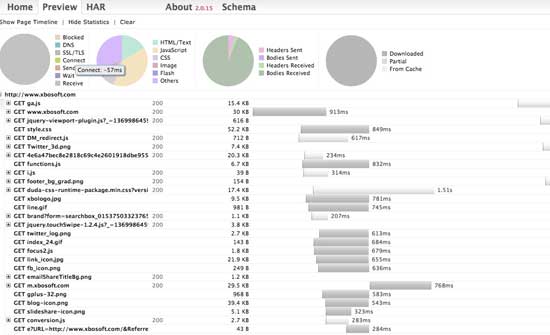
Figure 13. Mobitest HAR Viewer showing results from iPhone4 with iOS 5.0.
As you can see, it shows each object and the load time along with other statistics shown in the pie chart. On the pie chart, when you mouse over the different types of delays (blocked, DNS, SSL, etc.), you can see the time delay. In this instance, we can see that the connect time is 57 ms. This is much different than just examining download speeds because the connect times which are the time that the server establishes communication with the browser, can be influenced by protocols and packet sizes as they initially begin to start communicating. This is more dependent on the network itself and its configuration rather than the pure speed of the network itself. In this way, you can see if your application is suited for, or can be tuned to communicate better depending on the network it is predominately used on. Looking down further in the chart, we also see that m.xbosoft.com was loaded about halfway down the page with a download time of 700+ ms. With this kind of information, you can really dig into what could be slowing things down and possibly examine the order of things that could effect the user experience.
Just for fun, we decided to use another HAR viewer and another web site to see the results from using a different tool. Shunra's NV also contains a HAR viewer. We tested ABCNews.com for both abcnews.go.com/m and abcnews.go.com. As with www.xbosoft.com, for mobile users, after inputting abcnews.com on a mobile browser, the browser will send a request that includes the browser's information to the abc news server. Then the server will judge if the request is from a mobile or desktop platform and send the mobile user to abcnews.com/m, and desktop user to abcnews.go.com.
Let's do some analysis. We used Shunra's NV to get the following figures that show a waterfall timeline view for http://abcnews.go.com/m tested with3G on Samsang Galaxy 3 (Android 4.1 platform).

Legend: (DNS = Domain Name System)
First View:
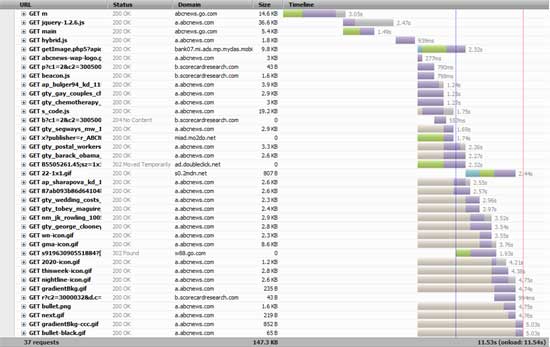
Figure 14. Step HTTP Download Graph via Shunra's NV HAR Viewer
From Figure 14, we can see which parts need to be improved or optimized. As can be seen on bottom right corner, total download time was greater than 11.5 seconds (download 147.3KB data 37 requests sent). We can also see that some image files (gif and png files) take a long time to download, so the developer should consider making the images smaller. Especially for a site optimized for mobile, many forget that the screen sizes are so small, thus high resolution images are rarely needed.
Mobile Network Performance Affects Your Application
These days, many companies operate both a mobile site, or site specialized for mobile access and a normal web site for desktop access. Adobe did a survey that indicated that 45% [2] of web sites only have a desktop site currently, but that mobile devices still can visit their web site. As desktop web sites are not specially designed for mobile, they usually open slowly and have UI issues with some components (menus, pictures) sometimes displayed out of order in addition to being very slow as we've shown above in our analysis. Because of this, if you don't have a specialized mobile site, then you need to design your desktop site with considerations for mobile users. In doing so, you not only have to design the screens and workflows more concisely to accommodate slower network speeds, but you also need to design for different and complex mobile scenarios. These scenarios and the user experience depend not only on your mobile software and its UI design, but also its technical adaptations to potential network performance issues.
[1] http://fonolo.com/blog/2012/03/customer-experience-statistics-2012/
[2] Adobe 2013 Digital Marketing Optimization Survey
Mobile Load Testing
Testing Performance of Mobile Apps - Part 1: How Fast Can Angry Birds Run?
Testing Performance of Mobile Apps - Part 2: A Walk on the Wild Server Side
Software Testing Knowledge
Software Testing Tutorials and Videos
Load Testing Tools and Performance Testing Software
Click here to view the complete list of archived articles
This article was originally published in the Summer 2013 issue of Methods & Tools
|
Methods & Tools Testmatick.com Software Testing Magazine The Scrum Expert |
|
Browse a selected list of upcoming Software Development Conferences |
Copyright © by 1995-2024 Martinig & Associates |
Privacy
Follow Methods & Tools on


