Understanding the Scrum Burndown Chart
Dusan Kocurek, ScrumDesk, www.scrumdesk.com
Being a startup is a great period in the company's lifetime. Developing a product in which you believe with a small and highly motivated Scrum team is remarkable experience that you hope will stay forever. Successful products grow quickly in complexity terms that lead to more complex processes and metrics just to measure the progress ending up in non-usable results. The software industry is recognizable by high failures rate, late delivery, low quality, but still producing each day products used by millions of people.
Back to Basics
In the last ten years, we have learned how to create products in an agile environment. Agility in software industry is more accepted these days because it brings visibility, intensive collaboration and simplicity. The clients appreciate radiated progress and insight into 'kitchen'. Agile packs everything we might remember from the beginning of the startup.
People tend to search for good agile metrics that provide this visibility. They expect to have a set of charts giving a deep understanding of the product status and the effort made and remaining. Reality, however, shows that such complexity is not necessary. Especially for the team, there are only few charts that team should use on daily basis. The Scrum Burndown chart is such a fundamental metric.
The Scrum Burndown chart is very simple. It is easy to explain, easy to understand. But there are pitfalls observed in many agile workshops and adoptions.
People tend to think the Burndown chart is so simple they do not give appropriate attention to understand what it says.
Burndown Chart
As a definition of this chart we can say that the Burndown chart displays the remaining effort for a given period of time.
When they track product development using the Burndown chart, teams can use a sprint Burndown chart and a release Burndown chart. This article concentrates on the sprint Burndown chart as it is used on daily basis by Agile and Scrum teams.
Sprint Burndown Chart
Teams use the sprint Burndown chart to track the product development effort remaining in a sprint.
General speaking the Burndown chart should consist of:
Companies use different attributes on the Y axis. All of them have benefits and drawbacks.
The number of stories
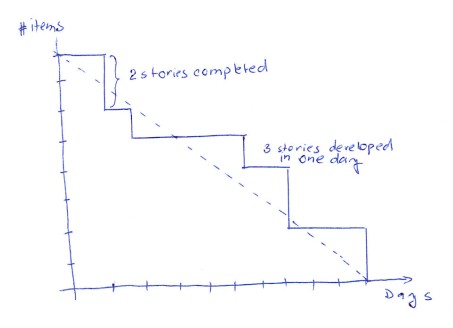
New agile teams used to start with the Burndown chart that displays the number of items on the Y axis.
It is a big mistake if they are allowed to continue with this approach. The reason is simple; stories require different effort to be completed. The first completed story can be two times bigger than the second one, but the chart does not explain the real iteration status.
Time unit
Time unit (hours or days) represents remaining time necessary for completion.

The benefit of displaying time is that it provides more granular view of progress, but it leads to micromanagement as well. It is typically suggested for new agile teams. Teams are often asked to carefully track time spent and remaining time, but all those who ask their team to do so should understand that the team is hired to develop a real product, not to spend amounts of time. Therefore most agile teams track a remaining size.
Remaining size
The chart displays the remaining size of all stories in a sprint backlog that needs to be done, using story points.
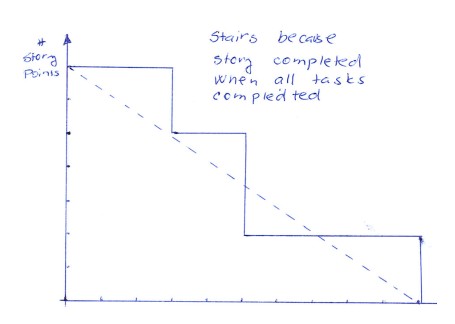
Stories are typically bigger items than tasks. Stories are also considered as done only when all tasks are completed. This leads to stairs in the Burndown chart.
Such stairs are usually not evaluated correctly. Especially management reads them as 'no progress' while they mean 'effort continues, it has not been completed yet'. Steps could be smaller if stories are broken down in an appropriate way.
More experienced teams work with stories (level of what, not how), that are enough for a daily synchronization. It is less comprehensive, but sufficient. It allows to have shorter daily meetings that are more focused on 'what we solved, what remains'.
Bring an Understanding
Simplicity of the chart does not help if process gaps need to be identified. In this case, two lines are not enough as they simply display a summary of work for all team members and the gaps need to be identified on a task board.
Usually it is unclear if a team is too late or somebody added additional work. Especially, in the case that an equal amount of work has been completed, there will be no progress indicated.

In this situation, viewing the total size of the sprint backlog should be helpful. Any change in the total size provides a clear explanation for the actual line issue.

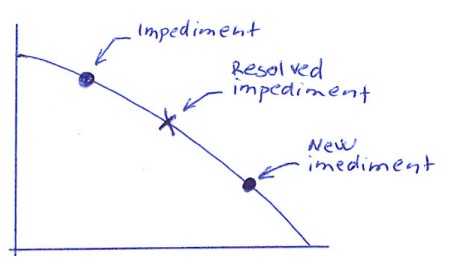
It might be helpful to display impediment indicators as well. I think that impediments are a pain that should be visible. Having them on a Burndown chart is a good way to combine them with the progress giving the sprint overview.
What a Burndown Chart Can Say
There are only two lines drawn in Burndown chart, but the situation they describe might have different reasons. In workshops, I can see that even certified Scrum masters are not able to explain situations described by Burndown charts correctly.
Ideal Team

Such diagram indicates the great team able to organize itself. It indicates a great product owner who understands the reason for a locked sprint backlog and a great Scrum master able to help the team. The team is not over-committing and finished the spring backlog on time. The team is also able to estimate capacity correctly. No corrective action is necessary in such case.
Great Team

Such progress might be observed on charts of experienced teams. The team has completed work on time and met the sprint goal. They also have applied the principle of getting things done, but the most important is they have adapted a scope of the sprint backlog to complete the sprint. At the end the team has a possibility to complete some additional work.
In the retrospective, the team should discuss the reasons of late progress in the first half of the sprint and solve issues so they are better in the next sprint. The team should also consider the capacity that they are able to complete.
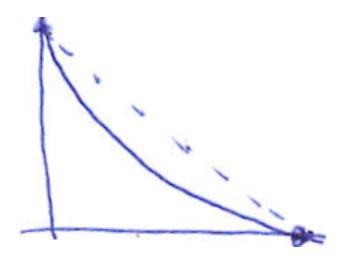
Nice Team
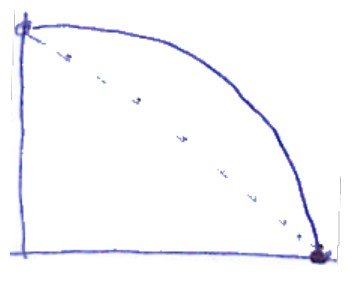
This is a typical progress that can be observed in many experienced agile teams.
The chart says again that the team was able to complete their commitment on time. They adapted the scope or worked harder to complete the sprint. The team is self-reflecting.
The team should discuss change of plan immediately as they see the progress has been slowing down from the beginning of the sprint. Typically it is suggested to move a low priority item from the sprint backlog to the next sprint or back to the product backlog.
Boom. It Is Too Late.

This burndown chart says: "You have not completed your commitment".
The team has been late for the entire sprint. The team did not adapt the sprint scope to appropriate level.
It shows that the team has not completed stories that should have been split or moved to the next sprint. In such situation the capacity of the next sprint should be lowered. If this happens again, corrective actions should be taken after a few days when slower progress is observed. Typically, lower priority story should be moved to the next sprint or back to the product backlog.
Boom. Too Early.

The team finishes its work sooner than expected. The stories were implemented, but the team didn't work on additional stories even it had the capacity to do it.
The stories were probably overestimated, therefore the team finished them earlier. Also the velocity of the team has not been probably estimated correctly.
The Scrum Master must be more proactive in either getting the team to fix estimation or ensure additional stories are ready to be added into the current sprint.
Let's Have a Rest
The team with such progress has a problem. The problem is either the team committed to less than they are able to complete or the product owner does not provide enough stories for the sprint.
The reason might be also an over-estimation of complexity, which ends up in completion earlier than expected at the beginning of the sprint.
The Scrum Master should identify this problem earlier and ask the product owner to provide the team with more work. Even if stories are over-estimated, the team should at least continue with stories from the next, already preplanned, sprint.
Oh, Management Is Coming!

The team is probably doing some work, but maybe it does not update its progress accordingly. Another reason might be that the product owner has added the same amount of work that was already completed, therefore the line is straight.
The team is not able to predict the end of the sprint or even to provide the status of the current sprint.
The Scrum Master should improve it Scrum masterships and coach the team on why it is necessary to track the progress and how to track it.
Such team should be stopped after two or three days that shows a flat the line of progress and should immediately apply corrective actions.
Do Your Duties

The team is non-functional on many levels. The Scrum Master of this team is not able to coach the team why it is necessary to track progress on daily basis. The product owner does not care about development progress either.
To fix this situation the team should restart. Restart from scratch by training and do a retrospective to figure out why this is happening.
Zero Effort

A chart like this indicates that stories or tasks were not estimated during the sprint planning meeting and the sprint has not officially started yet.
To fix this situation, team should immediately arrange a planning meeting, estimate the user stories, include them in the sprint according to their velocity and start the sprint.
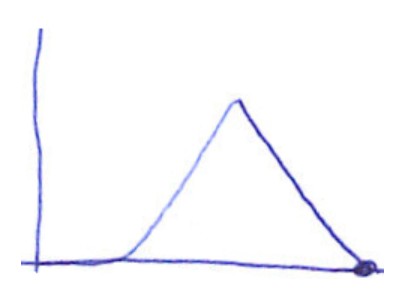
Up to the Sky

The first sprint typically looks like that. It is good source of knowledge because the team has failed significantly and it is highly visible.
Stories or tasks were added into the sprint backlog everyday without any progress recorded. Another reason might be that tasks were re-estimated constantly during the sprint.
The mistake is that the team did not identify the problem that the chart displays.
The sprint backlog should be reevaluated and rearranged immediately. The coach might be helpful, as an experienced Scrum master and product owner should often facilitate this situation.
Bump on the Road
The team has not started sprint correctly. They added stories after the sprint had started. It is positive that they recognized that planning is missing planning, it is however too late. The team should be careful about the capacity estimation as planning happened in the middle of the sprint, not before it.
In such case it is suggested to restart the sprint, even within a shorter timeframe.
Progress from Long-Run Perspective
Burndown charts described in previous paragraphs are description of iteration. But does a nice Burndown chart indicate a great team? Maybe if your team indicates great progress for more than one iteration. Does the team believe in such success? I would be personally careful. We all know about changes coming every minute. Maybe the team provides conservative estimation for their safety.
Management usually takes care about the improvement of velocity, sprint by sprint. Please, do not expect that. Velocity is not an indicator of the team. Velocity is not a KPI by which you should measure your team. Velocity is just capacity planning tool. Nothing more, nothing less. Asking people to accomplish more story points in iterations will result in stories that have more story points estimated without real reasons. It could be name as "Story points inflation".
Finally
I've started with a description of the startup environment in which the team spirit is crucial for success. Agile is probably the best way to develop product in startups because it allows focusing on product. The product often needs to get to market as soon as possible without losing competitive advantage. But even such agile environment needs a focus. Burndown charts are easy way how to radiate visibility on your path, but they should be read and understood correctly without early conclusions. I hope this article will provide you a guideline on how to help your teams.
Related Agile Articles
Adaptive Project Management Using Scrum
Five Symptoms of Mechanical Agile
More Agile Knowledge
Click here to view the complete list of archived articles
This article was originally published in the Winter 2011 issue of Methods & Tools