|
Software Development Magazine - Project Management, Programming, Software Testing |
|
Scrum Expert - Articles, tools, videos, news and other resources on Agile, Scrum and Kanban |
Aspects of Kanban
Karl Scotland, https://availagility.co.uk
Introduction
The Kanban software development community can be traced back to Agile2007 in Washington DC. At that conference a number of people were talking about their different approaches to development that they were using. Chris Matts was talking about Real Options and Feature Injection, Arlo Belshee was talking about Naked Planning, and David Anderson was talking about Kanban. All three had some similarities, which inspired a group of people to go away and experiment themselves and share their experiences. The name which emerged as an identity for the group was "Kanban".
Kanban is the Japanese word for visual card, and can have a number of interpretations with respect to software development. Firstly, it could be used to refer to the index card commonly used by Agile teams. Secondly, it could be used to refer to an Agile team's task board, or story board. Finally, it could be used to refer to the whole system within which an Agile team works.
In his book "Toyota Production System" [1], Taiichi Ohno says, "The two pillars of the Toyota production system are just-in-time and automation with a human touch, or autonomation. The tool used to operate the system is kanban." With this perspective, a Kanban System for Software Development refers to the whole system, and not simply the tool or the board. The community chose to name the systemic approach after the tool that inspired much of the thinking.
Viewing Kanban as a systemic approach leads to Systems Thinking. John Seddon, in his Vanguard Method [2], says that management thinking defines the system which defines performance. In order to improve the system, we should first understand the purpose of the system, create measures which help to determine whether the system is meeting that purpose, and then put a method in place to enable the system to meet that purpose.
Kanban is a way of creating a method, and generating metrics, in order to improve capability to meet a purpose. The remainder of this article discusses five aspects of a Kanban System; workflow, visualisation, work in process, cadence and continuous improvement. These aspects are not practices to be followed, but key areas to consider when thinking about the method used to change and improve an organisations delivery capability.
Workflow
Workflow is the understanding of how business or customer value travels through the Kanban System. The Agile community recognised that software development is a knowledge creation activity which includes randomness and variation and the "Inspect and Adapt" mantra is the response which makes the impact visible such that the feedback can be used to learn and respond accordingly. We can take this further by understanding the mathematics and science behind the randomness and variation and exploiting this to our advantage.
Recognising the workflow through an activity such as Value Stream Mapping can give us this additional transparency which we can use to influence our process. Value Stream Mapping is so called because its focus is on understanding how units of value flow through a system. For software development, this can be generalised into how units of value expand into smaller units of work, which then collapse back to deliver the original value.
For example, a specific Benefit to a customer may expand into a number of Features, which may expand into various User Stories, which may then each expand into Tasks. The Tasks subsequently collapse back together to realise the User Stories, which realise the Features, which ultimately realise the Benefit.
Understanding the workflow thus consists of knowing what we consider to be of value and what expand and collapse points there are to deliver that value through the system. Making the expand/collapse patterns explicit helps us to deliver the value more effectively across the whole value stream.
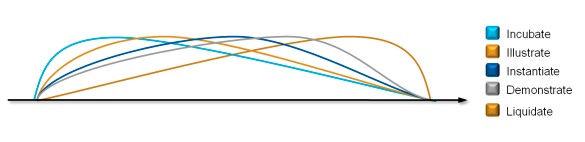
It could be argued that the value often goes through a typical "waterfall" workflow. This usually has baggage associated with it, however, so instead we can generalise the following workflow:
Incubate > Illustrate > Instantiate > Demonstrate > Liquidate
Incubation is when something is still an idea. It may grow and evolve on its own, but without significant investment. Illustration is when the idea starts to take shape into something which can be described more concretely, typically with user stories and examples (or tests). Instantiation is when the idea is built and tested. Demonstration is when it is completed and ready to be accepted by the business. Liquidation is when the idea is released and realising its value.
Another way of thinking about discovering a workflow is to view it as process archaeology. A process often has many layers, and by digging through those layers we can surface what is really going on. This will typically involve talking to the team members about how they really work, and it will often result in something other than what was expected, as problems that were previously hidden are surfaced.
Common items to look for in a workflow include queues and batches, and failure demand. Queues and batches are points in the workflow where the work is being processed. Queues are where work is building up because there is not enough capacity to process it and batches are where work is being held to be handed over and processed in a large volume. Failure demand is where is work the result of not doing some, or not doing something right. Rather than optimising a value stream for failure demand, the failure demand itself should be avoided.
It is important to remember that workflow stages are not equivalent to people or roles, and that having transparency of stages in a workflow does not imply having silos or specialisation. Instead, by focussing on letting the work flow across the stages, we can move towards a one piece flow, where a multi-skilled, cross functional team can work as a single cell to progress the value through the system. A generalised-specialist approach means that team members can both focus on one particular stage, while still being involved across the whole process, in the same way the "Type C" development is described in the "New New Product Development Game" [3].
Visualisation
Visualisation is the means by which we can understand the work and the workflow by using a kanban board to create a powerful visual management tool that shares a mental model which is visual, interactive and persistent.
In a recent TED Talk [4], Tom Wujec explains how this works when he talks about three ways that the brain creates meaning. Firstly, visualisation creates a mental model because of the way that different areas of the brain process different visual inputs such as shape, size, and location. Secondly, interaction enriches the mental model further through engagement. Finally, persistence allows the mental model to be part of an augmented memory which can evolve over time.
This leads to the idea of boundary objects. Brian Marick wrote an introductory paper [5] in which he talks about communities and practice and interest. A community of practice is formed around a work discipline, while a community of interest is formed around a common problem or concern. Communities of interest are made up of members of different communities of practice. A boundary object provides a means for communities of interest to communicate across their different practices.
Marick lists several properties of a boundary object which can be useful to bear in mind when building a kanban board; it should be a common point of reference for the community of interest, represent different meaning to different members of the community and help translation between the meanings, support coordination and alignment of the work within the community, be a plastic working agreement which evolves as the community learns, and address different concerns of the community members simultaneously.
A kanban board can be considered to be a boundary object when it is a social artefact which is a focal point for a team. By visualising a team's work, it becomes a common point of reference. The representation of the work, and its status, enables communication and coordination between all team members, as well as visualising the workflow and policies that are the team's working agreements. The kanban board should be able to evolve with workflow and policies over time. Thus a kanban board represents the shared mental model which is created collectively and collaboratively, and helps clarify the meaning of what the board is representing.
Another relevant set of ideas to visual management are those raised by Dan Pink when he talks about the surprising science of motivation. In his book "Drive" [6], he says that rather than the carrot and stick approach of extrinsic motivation, a better approach is intrinsic motivation, which consists of three elements; autonomy, mastery and purpose. Autonomy, or the "desire to direct our own lives", is achieved when team members can see what needs doing, understand the working agreements, and choose themselves what they should do. Mastery or "the urge to get better and better at something that matters" is achieved through being able to interact with the kanban board to evolve and improve it. Purpose, or "the yearning to do what we do in the service of something larger than ourselves", is achieved when the persistence of the kanban board makes it clear what the value of the work is and why it is being done.
A kanban board is a visualisation multiple pieces of data. In his classic book "The Visual Display of Quantitative Information" [7], Edward Tufte introduces a set of principles for the effective display of data and it is insightful to review some of these ideas.
Tufte talks about a number of different types of graphical designs. Time series is probably the most common, where time is along the horizontal axis, and another data type along the vertical. This is probably the least relevant design, because a kanban board is typically a snapshot of the current status. Similarly, a space time narrative, which tells a story in a spatial dimension over time, may not be the most obvious choice. It does raise the question of visualising the narrative of the work over time though, which could be interesting. Maps also introduce some different ideas. What would a kanban board look like it showed the terrain of a project, and where each piece of work was on that terrain? The most common form kanban board is probably a relational one, where the two axes show different types of information, such as scope and status.
Most of Tufte's book is spent discussing ways of improving the way that data is presented; specifically, maximising data ink, reducing chart junk, and improving data density. Data ink is the ink that actually represents data. While kanban boards generally use more than just ink, the principle holds true for making sure that as far as possible, anything on the board should hold information. The corollary to this is that anything which isn't data ink is chart junk. Grids, redundant data, or decorations and embellishments for aesthetics may create noise which masks the real story. Finally, data density is the amount of data within the given space. The eye can take in a high precision of detail, so by maximising the data ink and being clever with multi-functioning graphical elements, it is possible to visualise many dimensions in a small space.
A kanban board is what Tufte would call a multi-variant display, with the variants typically being the usual project management details, but also including the concerns of any member of a board's community of interest. As a starter, there are the popular "iron triangle" variants of scope, time, resource and quality. Other common variants are things like priority, status, issues, risks, constraints, dependencies and assumptions. More recently, teams have been talking in terms of variants such as capacity and demand, not to mention value and other economic aspects.
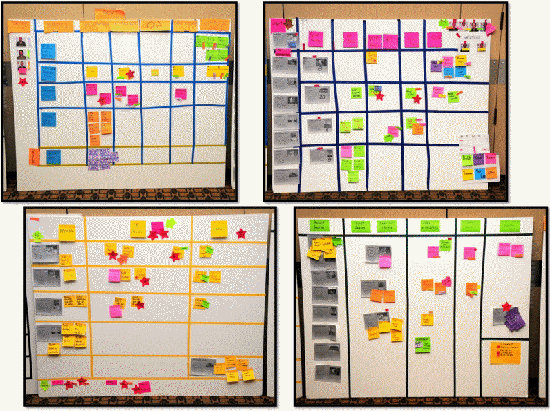
To visualise all these variants we can use a number of techniques. Properties such as size, colour, format, location and alignment can all create multi-functioning graphical elements to achieve a high data density, while for a physical board, material and texture can add further depth. The following examples are from a Visual Management workshop run by Xavier Quesada Allue [8] at Agile2009. They show different solutions to the same problem, using a variety of styles, techniques and materials.
Work In Process
Work in Process (WIP), and the way it is limited, is the means by which we can create a pull system which balances capacity and demand through the value stream.
In a pull system, work is processed through being signalled, rather than being scheduled. This is what avoids a build up of inventory, and enables work to flow through the system as capacity allows. Satoshi Kuroiwa, a former Toyota manager, used the analogy of a chain of paperclips in a talk at Agile Japan in 2009. Pushing the paperclips will inevitably cause them to pile up, whereas pulling them will result in them moving smoothly.
Applying this to a software development workflow means that upstream work can be made available, but it is the team members' responsibility to decide when they are able to take it. The act of taking, or pulling, the work, is a signal for the more upstream work to be processed. However, when work is available but not being pulled, then production upstream will gradually throttle down to avoid any pile-up. With a push system on the other hand, work will be scheduled and handed downstream regardless of whether there is capacity to process it or not.
Work in Process (WIP) has an impact on productivity, inventory and teamwork, and by being aware of WIP, and reducing and limiting it, we can improve Kanban System.
Productivity can be measured in terms of cycle-time and throughput of valuable units of work. Cycle time is the length of time to complete a process and throughput is the amount of output from a process in a given period of time. Cycle time and throughput are both improved by decreasing WIP. A simple example of this effect is CPU load, where application performance goes down as CPU load increases. The effect can be explained by looking at Little's Law for Queuing Theory:
Cycle Time = Number of Things in Process / Average Completion Rate
Little's Law tells us that to improve cycle time, there are two options; reduce the number of things in process or improve the average completion rate. Of the two, reducing the number of things in process is the easier, and once that is under control, then the more challenging changes to improve completion rate can be applied.
A further understanding can come from Traffic Flow Theory:
Flow = Speed * Density
Traffic jams occur as traffic density increases, and traffic speed decreases. However, when traffic density decreases, speed only increases to a point (which should be the speed limit). As a result there is a point at which decreasing WIP below a certain density will reduce throughput.
Another factor in improving cycle time and throughput is that of multitasking. Reducing multitasking is beneficial for two primary reasons.
Time is lost to context switching per task, so fewer tasks means less time lost. Gerald Weinberg, in his book "Quality Software Management: Systems Thinking" [9] suggests that 20% time is lost per additional task. Thus 1 task can consume 100% of time available, 2 tasks will consume 40% of time available each with 20% lost to context switching, 3 tasks will consume 20% of time available each with 40% lost to context switching etc.
Performing tasks sequentially yields results sooner. As the diagram below shows, multi-tasking A, B and C (on the top), delivers A much later, and even C slightly later, than sequentially (on the bottom).

Dr. Eliyahu Goldratt introduced the idea of throughput accounting in his business novel The Goal [10] Throughput accounting suggests that the business goal is to make a profit, and that this is determined by work in process, operating expense and throughput. Profit is increased by decreasing work in process, decreasing operating expense and increasing throughput.
Any features we have developed, but not yet released, can be considered inventory. Therefore, as well as helping to improve cycle time and increase throughput, limiting work in process also helps to increase profit by reducing inventory. In his keynote at Agile2009, Alistair Cockburn also introduced the idea that for software development, the unit of inventory is the unvalidated decision [11]. By limiting WIP we are focussing on getting feedback on fewer decisions sooner.
Finally, by having fewer work items in process, then the team is able to focus more on the larger goals, and less on individual tasks, thus encouraging a swarming effect, and enhancing teamwork. Limiting WIP like this can seem unusual for teams, and there is often a worry that team members will be idle because they having no work to do, but are unable to pull any new work. The following guidelines, in priority order, can be useful to help in this situation.
- Work directly on existing work to progress it
- Collaborate with team members on existing work to remove a bottleneck
- Begin working on new work if capacity is available
- Find some other useful work
When team members have to find some other useful work then "bubbles of slack" are formed around the work. This creates opportunities for improvement without needing to schedule them with techniques such as Gold Cards. This can be work which won't create any work downstream, but will improve future productivity and can be paused as soon as existing kanban slots become available. Investigative work such as technology spikes, refactoring or tool automation, and personal development or innovation work, are all activities which might help the team in the future.
Cadence
Cadence is the mechanism that teams use to establish a reliable and dependable capability. A consistent cadence demonstrates a predictable capacity and gives some confidence in coordinating the upcoming work when it is being triggered rather than scheduled.
Vanilla Agile time-boxing is one specialised form of cadence. It is a metronomic cadence with a single tick. All the main process events are based around this single tick which occurs on the time-box boundaries. In addition, the unit of work, commonly User Stories, should be small enough to be scheduled into the time-box, and subsequently completed in the same time-box. However, while User Stories in process can be limited within a time-box, they don't always fit into one exactly. Additionally, while releases can occur at the end of each time-box, User Stories are only potentially shippable product increments, but may not be coherent product increments.
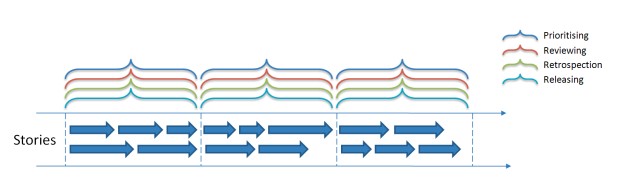
The various events can be decoupled, however, such that they happen separately at different rhythms. This creates a polyrhythmic cadence, more like a Drum Circle, where each drum represents a different event. The rhythm is more complex than the single tick of a metronome, and can be more varied. Units of work can be larger Minimal Marketable Features (MMFs), which while needing to be as small as possible, are not constrained be being required to fit into a time-box. Instead, an MMF is able to flow over a number of process events while it delivers a releasable coherent product increment. Prioritising, planning, reviewing, retrospection and releasing all still happen regularly, but because they are de-coupled, they can happen independently, at differing rates, which may provide more freedom in creating a natural process.

A cadence is usually 'harmonic', in that there is a neat overlap between the different rhythms, and generally keeps a regular 'time signature' to create consistency. However, it does not have to be, and a look at some definitions of cadence from dictionary.com can show why.
- In music, the ending of a phrase, perceived as a rhythmic or melodic articulation or a harmonic change or all of these; in a larger sense, a cadence may be a demarcation of a half-phrase, of a section of music, or of an entire movement
- Music. A progression of chords moving to a harmonic close, point of rest, or sense of resolution.
- The flow or rhythm of events, esp. the pattern in which something is experienced: the frenetic cadence of modern life.
Thus cadence is what gives a team a feeling of demarcation, progression, resolution or flow. It is a pattern which allows the team to know what they are doing and when it will be done. For very small or mature teams, this cadence could by complex, arrhythmic or syncopated. However, it is enough to allow a team to make reliable commitments because recognising their cadence allows them to understand their capability or capacity.
The appropriate cadence for a team will be influenced by their transaction and coordination costs. Transaction costs are those associated with performing an activity. For example, the cost of making a release is a transaction cost. Coordination costs are those associated with the logistics of an activity. For example, the cost of getting people together to manage a release is a coordination cost.
Thinking in terms of transaction and coordination costs can provide the basis for establishing an appropriate cadence for the various events such as prioritisation, planning, reviewing, retrospection and releasing. Focussing on reducing these costs can subsequently allow the cadence to change as delivery capability improves.
The end goal of reducing costs and improve cadence is to be able to quickly, reliably and frequently release valuable software. In doing so, we can help to further reduce costs. David Anderson uses the example of over-ground and under-ground trains. Over-ground trains, which run less frequently, tend to require more planning by looking at a timetable and travelling to the station at the right time to avoid unnecessary waiting. Under-ground trains, which run more frequently, tend to require less planning because it is safe to turn up and catch a train quickly. Thus by releasing quickly, reliably and frequently, we can reduce the need for much of the planning overhead.
Once a cadence has been established, and a delivery capability understood through measuring cycle-time and throughput, then predictability can be achieved through setting Service Level Agreements (SLAs). A SLA is not a promise, or a target, but a way of providing information about when deliverables can be expected. It is a gentleman's agreement, rather than a contract, that when a team accepts a piece of work, it should be delivered with a known time period.
By releasing frequently, to a known cadence, with an agreed SLA, a team can build trust that it is delivering to its full capacity
Continuous Improvement
Continuous Improvement is how a team constantly develops a Kanban System's capability to meet its purpose. A Kanban System should create an economy of flow, rather than an economy of scale, and the ultimate goal is to eliminate the Kanban System.
In their book "Learning to See"[12], Mike Rother and John Shook use the phrase "Flow where you can, pull when you must". A Kanban System allows the work to be pulled, but in order to really achieve flow the team members should be always looking for ways to keep the work moving, rather than keeping themselves busy.
One approach to continuous improvement is to reduce WIP limits. When a Kanban System appears to be working smoothly, lowering a WIP limit is analogous to lowering the waterline. It will expose the rocks, and new bottlenecks and constraints will be discovered. As a result teams can work to remove the new bottlenecks and constraints until work is flowing through the system smoothly again.
Another approach to continuous improvement is through retrospectives and other spontaneous change events (sometimes known as kaizen). When teams naturally refine and grow their capability, they often discover that they consistently have free space on their Kanban Board. This is a sign that they can retrospectively lower their WIP limits as a result of an improvement.
These two approaches can be related to the states described by Mihalyi Czikszentmihalyi in his book "Flow: The Psychology of Optimal Experience" [13]. Pre-emptively reducing a WIP limit is equivalent to moving a team through a state of anxiety, where the skills required are greater the current ability. Retrospectively reducing a WIP limit is equivalent to moving a team through a state of boredom, where the ability becomes greater that the skills required. Both paths are valid and can be used in context.

Implications
Viewing Kanban Systems from these aspects creates a meta-language to help describe and think about any process. Kanban is not a methodology, but something which can be applied to an existing way of working to understand it from the perspectives of workflow, visualisation, work in process, cadence and continuous improvement.
As a simple example, it is possible to describe the typical Agile time-box in terms of limiting work in process. Don Reinertsen gave me the analogy of a bucket of water as being a container for work in process. If the bucket is being continuously filled with water, then there are two approaches to avoiding the bucket from overflowing. The first is the equivalent of a time-box. If we understand the rate at which the water fills the bucket, then we can set a cadence to empty it before it overflows. The second is the equivalent of setting explicit WIP limits. If we have mechanism to signal when the bucket is nearly full, then we use that to empty it before it overflows.
These aspects can be used as levers, adjustable in either way, to tune a process. This is a different approach to describing a process in terms of practices which are more like knobs to be dialled up to ten (or eleven). The current configuration of the levers can be used to describe the current location of a team's process on its journey of continuous improvement, a bit like a trail marker identifies a location on a forest path.
Having a wide range of configurations of processes, using these aspects of a Kanban System, means that we can employ different processes in different contexts. We then work to improve those processes as we improve the underlying contexts. Using a ski slope metaphor, we can begin with a "Nursery Slope" process for an immature team or organisation which requires lots of safeguards in place due to low skill level, and over time move the team towards an "Off Piste" process when the team or organisation are very mature and require much less safety due to their high skill level.
Being able to begin with a "Nursery Slope" process and move towards an "Off Piste" process creates an evolutionary style of introducing change. This is on contrast to a revolutionary style of jumping straight into the implementation of a new process. An evolutionary approach is appropriate for contexts where there is strong resistance, or where a revolutionary change will highlight more issues than it is possible to resolve effectively. Large enterprises, with legacy technologies, complex architectures and political silos, may struggle to make the leap to a having multi-skilled, cross functional teams delivering production code every few weeks.
Whatever approach is taken, it should be remembered that method is only a means to achieving purpose, and measuring capability towards that purpose. Rather than focusing on being Lean or Agile which may (and should) lead to being successful, we should focuses on becoming successful, which will probably involve being Lean or Agile. The end goal is to be successful and a Kanban System is a means to that end, not an end in itself. To finish with a quote from "The Toyota Way"[14] by Jeffery Liker, "kanban is something you strive to get rid of, not to be proud of".
References
[1] Toyota Production System: Beyond Large-scale Production, Taiichi Ohno
[2] Freedom from Command and Control: A Better Way to Make the Work Work, John Seddon
[3] The New New Product Development Game: Hirotaka Takeuchi and Ikujiro Nonaka
[4] http://www.youtube.com/watch?v=wPFA8n7goio
[5] http://www.exampler.com/testing-com/writings/marick-boundary.pdf
[6] Drive: The Surprising Truth About What Motivates Us, Daniel Pink
[7] The Visual Display of Quantitative Information, Edward Tufte
[8] http://www.xqa.com.ar/visualmanagement/
[9] Quality Software Management : Vol. 1 : Systems Thinking: Systems Thinking, Gerald Weinberg
[10] The Goal: A Process of Ongoing Improvement, Eliyahu Goldratt
[11] http://alistair.cockburn.us/get/2754 (Powerpoint file)
[12] Learning to See: Value Stream Mapping to Add Value and Eliminate Muda, Mike Rother and John Shook
[13] Flow: The Psychology of Optimal Experience, Mihaly Csikszentmihalyi
[14] The Toyota Way: 14 Management Principles from the World's Greatest Manufacturer, Jeffrey Liker
More articles on Kanban
Making Your Culture Work with Agile, Kanban & Software Craftsmanship
More Agile and Lean Knowledge
Click here to view the complete list of archived articles
This article was originally published in the Summer 2010 issue of Methods & Tools
|
Methods & Tools Software Testing Magazine The Scrum Expert |
Copyright © by 1995-2025 Martinig & Associates |
Privacy
Follow Methods & Tools on


