|
Software Development Magazine - Project Management, Programming, Software Testing |
|
Scrum Expert - Articles, tools, videos, news and other resources on Agile, Scrum and Kanban |
A Decision Table Based Methodology for the Analysis of Complex Conditional Actions - Page 3
D. Robert Baker
Step 5: Collate Question Lists across Partitions
Having analyzed the data from each policy area as partitioned, it is necessary to collate this data into a master set.
This consists of:
- Master Question Set The Master Question Set is the union of all the separate question sets. All the separate question lists must be collated into one large list containing all the questions from all the smaller lists. Care must be taken with the intersections of these smaller sets. Guidelines for collation:
- Changes may be necessary to question wordings, types, ranges, or defaults to make them consistent across partitions.
- Some questions may have to be split or merged (see Figure 10).
- Two or more of these lists may contain synonymous questions i.e. questions that express the same thing, but use different terms, words, or expressions.
- Beware also of homonyms i.e. questions on two or more lists that appear to be the same, but in fact represent different data.
- It is also necessary to amalgamate the question dependencies noted in Step 4 to keep track of any necessary ordering in the datagathering during the actual decision evaluation process.
- Lastly, it is necessary to show for each question the partitions that originally used that question.
This allows:
- tracking of the effect of future question changes on policy partitions during maintenance,
- repartitioning of the policy area if desired, and
- prioritization of the questions within the question set based on usage across policy areas should it become necessary to limit or restrict the question set for any reason. If this is an issue, a more sophisticated priority ranking system than just marking an ëXí may be used, e.g. 1 ñ most important, 2 ñ 2nd most important, etc.
Figure 10 merged Master Question Set for the question lists of Figure 8. Individual questions are merged, question dependencies are added, and partitions where the questions are used are added.
Note: the first and only question of Partition A has been determined to be identical to the first two questions of Partition B. Thesecond expression has been chosen as more appropriate for use i.e. more granular, and inclusive of the first.
It is of prime importance in this process to maintain the semantics and intent of the original questions as approved by the individual subject area authorities. If significant, dubious, or confusing changes have been made during the amalgamation, it is wise to reaffirm approvals from the subject matter authorities.
- Question Dependency Chart The analyst may find it desirable for purposes of visualization or presentation to summarize the amalgamated question dependency information from all the smaller question lists in a directed acyclic graph as shown in Figure 11. Again, a question may depend on the answers to many other questions and many questions may depend on the answer to one question. There better not be any loops!

Figure 11 Question Dependency Chart for the Master Question Set of Figure 10
Step 6: Create the Data Dictionary
Creation of a data dictionary of variables for use by the decision evaluation software is now a simple matter.
- Create a variable name to hold the data solicited by each question Choose a term that is:
- indicative of the meaning of the data value held
- consistent with any coding standards preexistent in the policy area
- consistent with the coding standards of the decision table language
- Indicate a data source for each variable (question) Use a code to indicate where this data will come from. It could be solicited from a user, from any of a variety of databases, or from another source.
- Order the questions according to the question dependencies Ensure that questions that depend on the answers to other questions are asked after the questions they depend on. This information may even determine if the question is asked at all.
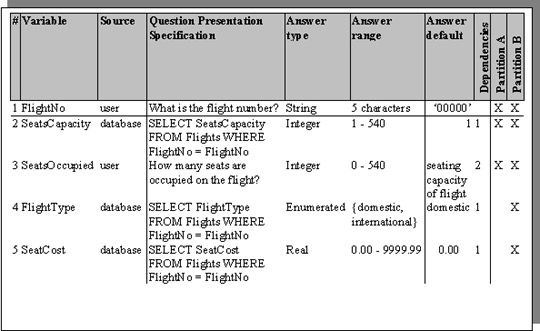
Figure 12 Data Dictionary for the Master Question Set of Figure 10.
Example data sources are split between user input and SQL database access.
Note: An extra row (question) has been added to the Data Dictionary in order to reduce user input by allowing database access for theother pieces of data.
- Adjust the question to match the data source Given that the data may come from any of a variety of sources, the question itself now becomes a question presentation specification i.e. What is actually asked of the information source to elicit the answer data? Some examples:
- user text ñ If the data is solicited from a user via text entry, the question presentation specification represents the text that will be presented to the user to solicit the answer data.
- It may be useful to add some explanatory text to the actual question to help the user fully understand the question. For example, instead of merely asking "How many seats are occupied on the flight?", it may be more desirable to explain further "How many seats are occupied on the flight? This only includes paying passengers, not complimentary, promotional, crew or jump seats."
- Also note that it is possible to have multiple specifications e.g. in a system designed for a multilingual environment, there would be a separate question presentation specification for each language in which the question would be asked.
- audio - If the data is solicited from a voice response system, the question presentation specification represents the audio file (or code necessary to play such a file) that will be played to the user to solicit the data. Here again, multiple specifications could be created to deal with a multilingual environment.
- database - If the data is solicited from a database, the question presentation specification represents the query (e.g. SQL) sent to the DBMS to solicit the data.
Step 7: Create the Decision Tables
The actual creation of executable decision tables is highly dependent on the software that reads, interprets, and executes them. To explain this process, it would be necessary to expound the syntax and semantics of that executing software. This of course, would vary with that software and is beyond the scope of this paper, which is limited to the requirements gathering and analysis phase of the overall process.
Conclusion: A Quick, Easy, Rigorous, and Repeatable Methodology
Decision table theory has been available since the dawn of the computing era. It has features that take advantage of human styles of perception and cognition and yet maintain rigor and conciseness. Serious attempts to automate direct machine execution of these decision tables in a non-scientific environment have been limited by
- paradigmatic emphasis being placed on other models
- lack of widely available, inexpensive spreadsheet software with a large trained user base
- lack of inexpensive and efficient decision table executing software
An analysis methodology has been presented which is structured and repeatable. Policy of interest is located, partitioned, clarified, and owned. All the information (data and logic) necessary to convert this data into an executable format is gathered, fleshed out, formatted, and approved.
At this point, given reliable decision table execution software, the entry of this data into executable decision tables should be a straightforward task not requiring the intervention of a skilled programmer with the subsequent delays and errors inherent in that extra step.
References
[1] Simon, H.A. 1960. The new science of management decision. New York: Harper & Row
[2] Holsapple, C.W. and Whinston, A.B. 1996. Decision support systems: a knowledge-based approach. St. Paul, MN: West
[3] Siler, William, Ph.D. [wsiler@aol.com]. "Building Fuzzy Expert Systems" [http://users.aol.com/wsiler/]
Click here to view the complete list of archived articles
This article was originally published in the Fall 2004 issue of Methods & Tools
|
Methods & Tools Testmatick.com Software Testing Magazine The Scrum Expert |
|
Browse a selected list of upcoming Software Development Conferences |
Copyright © by 1995-2024 Martinig & Associates |
Privacy
Follow Methods & Tools on


