|
Software Development Magazine - Project Management, Programming, Software Testing |
|
Scrum Expert - Articles, tools, videos, news and other resources on Agile, Scrum and Kanban |
Implementing Automated Software Testing - Continuously Track Progress and Adjust Accordingly
Thom Garrett, Innovative Defense Technologies, www.IDTus.com
This is an excerpt from the book "Implementing Automated Software Testing," by Elfriede Dustin, Thom Garrett, Bernie Gauf, Copyright Addison Wesley, 2009
"When you can measure what you are speaking about, and can express it in numbers, you know something about it; but when you cannot measure it, when you cannot express it in numbers, your knowledge is of a meager and unsatisfactory kind." - Lord Kelvin
Most of us have worked on at least one project where the best-laid plans went awry and at times there wasn't just one reason we could point to that caused the failure. People, schedules, processes, and budgets can all contribute. [1] Based on such experiences from the past, we have learned that as part of a successful automated testing (AST) program it is important that the right people with the applicable skills are hired, goals and strategies be defined and then implemented, and that steps be put in place to continuously track, measure, and adjust, as needed, against these goals and strategies. Here we'll discuss the importance of tracking the AST program, to include various defect prevention techniques, such as peer reviews and other interchanges. We'll then focus on the types of AST metrics to gather so that we can measure progress, gauge the effectiveness of our AST efforts, and help keep them keep on track and/or make adjustments, if necessary. Finally, we will discuss the importance of a root/cause analysis if a defect or issue is encountered.
Based on the outcome of these various efforts, adjustments can be made where necessary; e.g., the defects remaining to be fixed in a testing cycle can be assessed, schedules can be adjusted, and/or goals can be reduced. For example, if a feature is left with too many high-priority defects, a decision can be made to move the ship date, to ship the system as is (which generally isn't wise, unless a quick patch process is in place), or to go live without that specific feature, if that is feasible.
Success is measured based on achieving the goals we set out to accomplish relative to the expectations of our stakeholders and customers.
AST Program Tracking and Defect Prevention
In our book "Implementing Automated Software Testing (IAST)" in we cover the importance of valid requirements and their assessment; in another we discuss the precautions to take when deciding what to automate; and yet another section we discussed in detail the importance of peer reviews. Here we'll provide additional ideas that aid in defect prevention efforts, including technical interchanges and walk-throughs; internal inspections; examination of constraints and associated risks; risk mitigation strategies; safeguarding AST processes and environments via configuration management; and defining and tracking schedules, costs, action items, and issues/defects.
Conduct Technical Interchanges and Walk-throughs
Peer reviews, technical interchanges, and walk-throughs with the customer and the internal AST team represent evaluation techniques that should take place throughout the AST effort. These techniques can be applied to all AST deliverables-test requirements, test cases, AST design and code, and other software work products, such as test procedures and automated test scripts. They consist of a detailed artifact examination by a person or a group other than the author. These interchanges and walk-throughs are intended to detect defects, non-adherence to AST guidelines, test procedure issues, and other problems.
An example of a technical interchange meeting is an overview of test requirement documentation. When AST test requirements are defined in terms that are testable and correct, errors are prevented from entering the AST development pipeline that could eventually be reflected as defects in the deliverable. AST design component walk-throughs can be performed to ensure that the design is consistent with defined requirements - e.g., that it conforms to OA standards and applicable design methodology - and that errors are minimized.
Technical reviews and inspections have proven to be the most effective forms of preventing miscommunication, allowing for defect detection and removal.
Conduct Internal Inspections
In addition to customer technical interchanges and walk-throughs, internal inspections of deliverable work products should take place, before anything is even presented to the customer, to support the detection and removal of defects and process/practice omissions or deficiencies early in the AST development and test cycle; prevent the migration of defects to later phases; improve quality and productivity; and reduce cost, cycle time, and maintenance efforts.
Examine Constraints and Associated Risks
A careful examination of goals and constraints and associated risks should take place, leading to a systematic AST strategy and producing a predictable, higher-quality outcome and a high degree of success. Combining a careful examination of constraints together with defect detection technologies will yield the best results.
Any constraint and associated risk should be communicated to the customer and risk mitigation strategies developed as necessary.
Implement Risk Mitigation Strategies
Defined "light weight" processes allow for iterative, constant risk assessment and review without the dreaded overhead. If a risk is identified, appropriate mitigation strategies can be deployed. Require ongoing review of cost, schedules, processes, and implementation to ensure that potential problems do not go unnoticed until too late; instead, processes need to ensure that problems are addressed and corrected immediately. For example, how will you mitigate the risk if your "star" developer quits? There are numerous possible answers: Software development is a team effort and it is never a good practice to rely on one "star" developer. Hire qualified developers, so they can integrate as a team and each can be relied on in various ways based on their respective qualifications. One team member might have more experience than another, but neither should be irreplaceable, and the departure of one of them should not be detrimental to the project. Follow good hiring and software development practices (such as documenting and maintaining all AST-related artifacts) and put the right people on the project; we discuss the "how to" in our book "IAST." Additional risks could be missed deadlines or being over budget. Evaluate and determine risk mitigation techniques in case an identified risk comes to fruition.
Safeguard the Integrity of the AST Process and Environments
Experience shows that it is important to safeguard the integrity of the AST processes and environment. In IAST we discuss the importance of an isolated test environment and having it under configuration management. For example, you might want to test any new technology to be used as part of the AST effort in an isolated environment and validate that a tool, for example, performs to product specifications and marketing claims before it is used on any AUT or customer test environment. At one point we installed a tool on our Micron PC used for daily activities, only to have it blue-screen. It turned out that the tool we wanted to test wasn't compatible with the Micron PC. To solve the problem, we actually had to upgrade the PC's BIOS. An isolated test environment for these types of evaluation activities is vital.
The automator should also verify that any upgrades to a technology still run in the current environment. The previous version of the tool may have performed correctly and a new upgrade may perform fine in other environments, but the upgrade may adversely affect the team's particular environment. We had an experience when a new tool upgrade wasn't compatible with our e-mail software package any longer. It was a good thing we caught this issue, because otherwise an upgrade install would have rendered the tool useless, as we heavily relied on e-mail notification, for example, if a defect was generated.
Additionally, using a configuration management tool to baseline the test repository will help safeguard the integrity of the automated testing process. For example, all AST automation framework components, script files, test case and test procedure documentation, schedules, cost tracking, and other related AST artifacts need to be under configuration management. Using a configuration management tool ensures that the latest and most accurate version control and records of AST artifacts and products are maintained. For example, we are using the open-source tool Subversion in order to maintain AST product integrity; we evaluate the best products available to allow for the most efficient controls on an ongoing basis.
Define, Communicate, and Track Schedules and Costs
It is not good enough to base a schedule on a marketing-department-defined deadline. Instead, schedule and task durations need to be determined based on past historical performance and associated best estimates gathered from all stakeholders. Additionally, any schedule dependencies and critical path elements need to be considered up front and incorporated into the schedule. Project schedules need to be defined, continuously tracked, and communicated.
In order to meet any schedule-for example, if the program is under a tight deadline - only the AST tasks that can be successfully delivered in time are included in the schedule iteration. As described in IAST, during the AST Phase 1, test requirements are prioritized, which allows for prioritizing the most critical AST tasks to be completed as opposed to the less critical and lower-priority tasks, which can then be moved to later in the schedule, accordingly. Once the requirements are prioritized, an initial schedule is presented to the customer for approval and not before the System Under Test (SUT), AST requirements and associated level of effort are understood.
During the technical interchanges and walk-throughs, schedules are evaluated and presented on an ongoing basis to allow for continuous communication and monitoring. Potential schedule risks should be communicated well in advance and risk mitigation strategies explored and implemented, as needed; any schedule slips should be communicated to the customer immediately and adjustments made accordingly.
By closely tracking schedules and other required AST resources, we can also ensure that a cost tracking and control process is followed. Inspections, walk-throughs, and other status reporting allow for closely monitored cost control and tracking. Tracking cost and schedules and so forth allows for tracking of the project's performance.
Track Actions, Issues, and Defects
A detailed procedure needs to be defined for tracking action items to completion. Templates should be used that describe all elements to be filled out for action item reports.
Additionally, a procedure needs to be in place that allows for tracking issues/defects to closure, known as a defect tracking lifecycle. See IAST for a sample defect tracking lifecycle used in the open-source defect tracking tool Bugzilla. Various defect tracking lifecycles exist; adapt one to your environment, tool, and project needs. Once defined, put measures in place to verify that the defect or action item lifecycle is adhered to.
If an issue or defect is uncovered, a root cause analysis should be conducted. See that section later on for more on root cause analysis.
AST Metrics
Metrics can aid in improving your organization's automated testing process and tracking its status. Much has been said and written about the need for using metrics carefully and to not let metrics drive an effort, i.e. don't measure for the sake of measuring. As with our recommended lightweight and adjustable process described in IAST, we recommend to use these metrics as an enhancement to the AST effort not to drive the AST effort. Our software test teams have successfully used the metrics and techniques discussed here. As the beginning quote implies, if you can measure something, then you have something you can quantify.
As time proceeds, software projects become more complex because of increased lines of code as a result of added features, bug fixes, etc. Also, tasks must be done in less time and with fewer people. Complexity over time has a tendency to decrease the test coverage and ultimately affect the quality of the product. Other factors involved over time are the overall cost of the product and the time in which to deliver the software. Carefully defined metrics can provide insight into the status of automated testing efforts.
When implemented properly, AST can help reverse the negative trend. As represented in Figure 1.1, automation efforts can provide a larger test coverage area and increase the overall quality of a product. The figure illustrates that the goal of automation is ultimately to reduce the time of testing and the cost of delivery, while increasing test coverage and quality. These benefits are typically realized over multiple test and project release cycles.
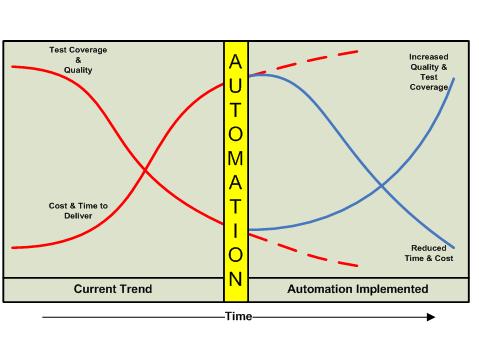
Figure 1.1 AST goal examples comparing current trend with automation implementation
Automated testing metrics can aid in making assessments as to whether coverage, progress and quality goals are being met. Before we discuss how these goals can be accomplished, we want to define metrics, automated testing metrics, and what makes a good automated test metric.
What is a metric? The basic definition of a metric is a standard of measurement. It can also be described as a system of related measures that facilitate the quantification of some particular characteristic. [2] For our purposes, a metric can be seen as a measure that can be used to display past and present performance and/or predict future performance.
Metrics categories: Most software testing metrics (including the ones presented here) fall into one of three categories:
- Coverage: meaningful parameters for measuring test scope and success.
- Progress: parameters that help identify test progress to be matched against success criteria. Progress metrics are collected iteratively over time. They can be used to graph the process itself (e.g., time to fix defects, time to test, etc.).
- Quality: meaningful measures of testing product quality. Usability, performance, scalability, overall customer satisfaction, and defects reported are a few examples.
What are automated testing metrics? Automated testing metrics are metrics used to measure the performance (past, present, and future) of the implemented automated testing process and related efforts and artifacts. Here we can also differentiate metrics related to unit test automation versus integration or system test automation. Automated testing metrics serve to enhance and complement general testing metrics, providing a measure of the AST coverage, progress, and quality, not replace them.
What makes a good automated testing metric? As with any metrics, automated testing metrics should have clearly defined goals for the automation effort. It serves no purpose to measure something for the sake of measuring. To be meaningful, a metric should relate to the performance of the effort.
Prior to defining the automated testing metrics, there are metrics-setting fundamentals you may want to review. Before measuring anything, set goals. What is it you are trying to accomplish? Goals are important; if you do not have them, what is it that you are measuring? It is also important to track and measure on an ongoing basis. Based on the metrics outcome, you can decide whether changes to deadlines, feature lists, process strategies, etc., need to be adjusted accordingly. As a step toward goal setting, questions may need to be asked about the current state of affairs. Decide what questions to ask to determine whether or not you are tracking toward the defined goals. For example:
- How many permutations of the test(s) selected do we run?
- How much time does it take to run all the tests?
- How is test coverage defined? Are we measuring test cases against requirements (generally during system testing), or are we measuring test cases against all possible paths taken through the units and components (generally used for unit testing)? In other words, are we looking at unit testing coverage, code coverage, or requirements coverage?
- How much time does it take to do data analysis? Are we better off automating that analysis? What would be involved in generating the automated analysis?
- How long does it take to build a scenario and required driver?
- How often do we run the test(s) selected?
- How many people do we require to run the test(s) selected?
- How much system and lab time is required to run the test(s) selected?
In essence, a good automated testing metric has the following characteristics:
- It is objective.
- It is measurable.
- It is meaningful.
- Data for it is easily gathered.
- It can help identify areas of test automation improvement.
- It is simple.
A few more words about metrics being simple: Albert Einstein once said, "Make everything as simple as possible, but not simpler." When applying this wisdom to AST and related metrics collection, you will see that
- Simplicity reduces errors.
- Simplicity is more effective.
- Simplicity is elegant.
- Simplicity brings focus.
It is important to generate a metric that calculates the value of automation, especially if this is the first time an automated testing approach has been used for a project. IAST discusses ROI measurement in detail and provides various worksheets that can serve as a baseline for calculating AST ROI. For example, there we mention that the test team will need to measure the time spent on developing and executing test scripts against the results that the scripts produce. If needed, the test team could justify the number of hours required to develop and execute AST by providing the number of defects found using this automation that would likely not have been revealed during a manual test effort. Specific details as to why the manual effort would not have found the defect can be provided; some possible reasons are that the automated test used additional test data not previously included in the manual effort, or the automated test used additional scenarios and path coverage previously not touched manually. Another way of putting this is that, for example, with manual testing you might have been able to test x number of test data combinations; with automated testing you are now able to test x + y test data combinations. Defects that were uncovered in the set of y combinations are the defects that manual testing may have never uncovered. Here you can also show the increase in testing coverage for future software releases.
Another way to quantify or measure automation benefits is to show that a specific automated test could hardly have been accomplished in a manual fashion. For example, say that during stress testing 1,000 virtual users execute a specific functionality and the system crashes. It would be very difficult to discover this problem manually, using 1,000 test engineers or possibly even extrapolation as it is still very commonly used today.
AST can also minimize the test effort, for example, by the use of an automated test tool for data entry or record setup. Consider the test effort associated with the system requirement that reads, "The system shall allow the addition of 10,000 new accounts." Imagine having to manually enter 10,000 accounts into a system in order to test this requirement! An automated test script can easily support this requirement by reading account information from a file through the use of a looping construct. The data file can easily be generated using a data generator. The effort to verify this system requirement using test automation requires far fewer man-hours than performing such a test using manual test methods. [3] The ROI metric that applies in this case measures the time required to manually set up the needed records versus the time required to set up the records using an automated tool.
What follows are additional metrics that can be used to help track progress of the AST program. Here we can differentiate between test case and progress metrics and defect and defect removal metrics.
Percent Automatable or Automation Index
As part of an AST effort, the project is either basing its automation on existing manual test procedures, or starting a new automation effort from scratch, some combination, or even just maintaining an AST effort. Whatever the case, a percent automatable metric or the automation index can be determined.
Percent automatable can be defined as the percentage of a set of given test cases that is automatable. This could be represented by the following equation:
                     ATC          No. of test cases automatable
          PA (%) = -------- = (----------------------------------- )
                     TC           Total no. of test cases

PA = Percent automatable
ATC = Number of test cases automatable
TC = Total number of test cases
When evaluating test cases to be developed, what is to be considered automatable and what is to be considered not automatable? Given enough ingenuity and resources, one can argue that almost anything can be automated. So where do you draw the line? Something that can be considered "not automatable," for example, could be an application area that is still under design, not very stable, and mostly in flux. In cases such as this, you should evaluate whether it makes sense to automate. See IAST for a detailed discussion of how to determine what to automate. There we discussed that we would evaluate, given the set of test cases, which ones would provide the biggest return on investment if automated. Just because a test is automatable doesn't necessary mean it should be automated.
Prioritize your automation effort based on the outcome of this "what to automate" evaluation. Figure 1.2 shows how this metric can be used to summarize, for example, the percent automatable of various projects or components within a project and to set the automation goal. Once we know the percent automatable, we can use it as a baseline for measuring AST implementation progress.

Figure 1.2 Example of percent automatable (automation index) per project (or component)
Automation Progress
Automation progress refers to the number of tests that have been automated as a percentage of all automatable test cases. Basically, how well are you doing against the goal of automated testing? The ultimate goal is to automate 100% of the "automatable" test cases. This can be accomplished in phases, so it is important to set a goal that states the deadlines for when a specific percentage of the ASTs should be automated. It is useful to track this metric during the various stages of automated testing development.
                      AA            No. of test cases automated
          AP (%) = -------- = (-------------------------------------- )
                      ATC          No. of test cases automatable

AP = Automation progress
AA = Number of test cases automated
ATC = Number of test cases automatable
The automation progress metric is a metric typically tracked over time. In the case of Figure 1.3, the time is weeks.

Figure 1.3 Test cases automated over time (weeks)
Test Progress
A common metric closely associated with the progress of automation, yet not exclusive to automation, is test progress. Test progress can simply be defined as the number of test cases (manual and automated) executed over time.
                   TC               No. of test cases executed
           TP = -------- = (-------------------------------------------- )
                    T               Total number of test cases

TP = Test progress
TC = Number of test cases executed
T = Total number of test cases
The purpose of this metric is to track test progress and can be used to show how testing is tracking against the overall project plan.
More detailed analysis is needed to determine test pass/fail, which can be captured in a more refined metric; i.e., we need to determine not only how many tests have been run over time and how many more there are to be run, but also how many of those test executions actually pass consistently without failure so that the test can actually be considered complete. In the test progress metric we can replace No. of test cases executed with No. of test cases completed, counting only those test cases that actually consistently pass.
Percent of Automated Test Coverage
Another AST metric we want to consider is percent of automated test coverage. This metric determines what percentage of test coverage the automated testing is actually achieving. Various degrees of test coverage can be achieved, depending on the project and defined goals. Also depending on the types of testing performed, unit test automation coverage could be measured against all identified units, or functional system test coverage can be measured against all requirements, and so forth. Together with manual test coverage, this metric measures the completeness of the test coverage and can measure how much automation is being executed relative to the total number of tests. However, it does not say anything about the quality of the automation. For example, 2,000 test cases executing the same or similar data paths may take a lot of time and effort to execute, but they do not equate to a larger percentage of test coverage. Test data techniques discussed in IAST need to be used to effectively derive the number of test data elements required to test the same or similar data path. Percent of automated test coverage does not indicate anything about the effectiveness of the testing taking place; it is a metric that measures its dimension.
                       AC            Automation coverage
          PTC (%) = ------- = (------------------------------- )
                       C              Total coverage

PTC = Percent of automated test coverage
AC = Automation coverage
C = Total coverage (i.e., requirements, units/components, or code coverage)
There is a wealth of material available regarding the sizing or coverage of systems. A useful resource is Stephen H. Kan's book Metrics and Models in Software Quality Engineering. [4]
Figure 1.4 provides an example of test coverage for Project A versus Project B over various iterations. The dip in coverage for Project A might reveal that new functionality was delivered that hadn't yet been tested, so that no coverage was provided for that area.

Figure 1.4 Test coverage per project over various iterations
Defect Density
Measuring defects is a discipline to be implemented regardless of whether the testing effort is automated or not. Defect density is another well-known metric that can be used for determining an area to automate. If a component requires a lot of retesting because the defect density is very high, it might lend itself perfectly to automated testing. Defect density is a measure of the total known defects divided by the size of the software entity being measured. For example, if there is a high defect density in a specific functionality, it is important to conduct a causal analysis. Is this functionality very complex, and therefore is it to be expected that the defect density would be high? Is there a problem with the design or implementation of the functionality? Were the wrong (or not enough) resources assigned to the functionality, because an inaccurate risk had been assigned to it and the complexity was not understood? It also could be inferred that the developer responsible for this specific functionality needs more training.
                   D             No. of known defects
          DD = ------- = ( ------------------------------- )
                  SS            Size of software entity

DD = Defect density
D = Number of known defects
SS = Size of software entity
We can't necessary blame a high defect density on large software component size, i.e. while generally the thought is that a high defect density in a large component is more justifiable than in a small component, the small component could be much more complex than the large one. AST complexity is an important consideration when evaluating defect density.
Additionally, when evaluating defect density, the priority of the defect should be considered. For example, one application requirement may have as many as 50 low-priority defects and still pass because the acceptance criteria have been satisfied. Still another requirement may have only one open defect, but that defect prevents the acceptance criteria from being satisfied because it is a high priority. Higher-priority defects are generally weighted more heavily as part of this metric.
Defect Trend Analysis
Another useful testing metric in general is defect trend analysis. Defect trend analysis is calculated as:
                   D              No. of known defects
          DTA = ------- = (--------------------------------------- )
                  TPE          No. of test procedures executed

DTA = Defect trend analysis
D = Number of known defects
TPE = Number of test procedures executed over time
Defect trend analysis can help determine the trend of defects found over time. Is the trend improving as the testing phase is winding down, or does the trend remain static or is it worsening? During the AST testing process, we have found defect trend analysis to be one of the more useful metrics to show the health of a project. One approach to showing the trend is to plot the total number of defects over time, as shown in Figure 1.5. [5]

Figure 1.5 Defect trend analysis: total number of defects over time (here after weeks in testing)
Effective defect tracking analysis can present a clear view of the status of testing throughout the project.
Defect Removal Efficiency
One of the more popular metrics is defect removal efficiency (DRE); this metric is not specific to automation, but it is very useful when used in conjunction with automation efforts. DRE is used to determine the effectiveness of defect removal efforts. It is also an indirect measurement of product quality. The value of the DRE is calculated as a percentage. The higher the percentage, the greater the potential positive impact on the quality of the product. This is because it represents the timely identification and removal of defects at any particular phase.
                        DT               No. of defects found during testing
          DRE (%) = ------------ = ( -------------------------------------------- )
                     DT + DA            No. of defects found during testing +
                                        No. of defects found after delivery

DRE = Defect removal efficiency
DT = Number of defects found during testing
DA = Number of defects found after delivery

Figure 1.6 Defect removal efficiency over the testing lifecycle effort
The highest attainable value of DRE is 1, which equates to 100%. In practice, we have found that an efficiency rating of 100% is not likely. According to Capers Jones, world-class organizations have a DRE greater than 95%. [6] DRE should be measured during the different development phases. For example, low DRE during analysis and design may indicate that more time should be spent improving the way formal technical reviews are conducted.
This calculation can be extended for released products as a measure of the number of defects in the product that were not caught during the product development or testing phases.
Automated Software Testing ROI
As we have discussed, metrics help define the progress, health, and quality of an automated testing effort. Without such metrics, it would be practically impossible to quantify, explain with certainty, or demonstrate quality. Along with quality, metrics also help with demonstrating ROI, covered in detail in IAST of this book. ROI measurement, like most metrics, is an ongoing exercise and needs to be closely maintained. Consider the ROI and the various testing metrics when investigating the quality and value of AST. As shown in Figure 1.7, metrics can assist in presenting the ROI for your effort. Be sure to include all facets in your ROI metric as described in IAST.
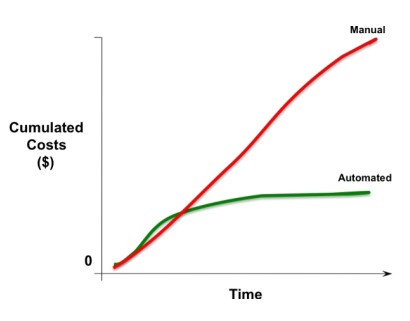
Figure 1.7 AST ROI example (cumulated costs over time)
Other Software Testing Metrics
Along with the metrics mentioned in the previous sections, there are a few more common test metrics useful for the overall testing program. Table 1.1 provides a summary and high-level description of some of these additional useful metrics.
Table 1.1 Additional Common and Useful Software Test Metrics [7]
Metric Name |
Description |
Category |
Error discovery rate |
Number of total defects found/Number of test procedures executed The error discovery rate is used to analyze and support a rational product release decision. |
Progress |
Defect aging |
The date a defect was opened versus the date the defect was fixed The defect aging metric indicates turnaround of the defect. |
Progress |
Defect fix retest |
The date a defect was fixed and released in a new build versus the date the defect was retested The defect fix retest metric indicates whether the testing team is retesting the fixes fast enough, in order to get an accurate progress metric. |
Progress |
Current quality ratio |
Number of test procedures successfully executed (without defects) versus the number of test procedures. The current quality ratio metric indicates the amount of functionality that has successfully been demonstrated. |
Quality |
| Problem reports by priority |
The number of software problem reports broken down by priority The problem reports metric counts the number of software problems reported, listed by priority. |
Quality |
Root Cause Analysis
It is not good enough to conduct lessons learned after the AST program has been implemented. Instead, as soon as a problem is uncovered, regardless of the phase or the type of issue - whether it's a schedule, budget, or software defect problem - a root cause analysis should be conducted, so that corrective actions and adjustments can be made. Root cause analysis should not focus on determining blame; it is a neutral investigation that determines the cause of the problem. For example, a root cause template could be developed where stakeholders can fill in their respective parts if a defect is uncovered in production. The template could list neutral questions, such as, "What is the exact problem and its effect?" "How was it uncovered and who reported it?" "When was it reported?" "Who is/was affected by this problem?" "What is the priority of the problem?" Once all this information has been gathered, stakeholders need to be involved in the discussion and determination of the root cause, how to resolve the issue (corrective action to be taken) and understand the priority of solving and retesting it, and how to prevent that sort of issue from happening in the future.
Defects will be uncovered despite the best-laid plans and implementations; corrective actions, and adjustments are always needed, i.e. expect the unexpected, but have a plan for addressing it Effective AST processes should allow for and support the implementation of necessary corrective actions. They should allow for strategic course correction, schedule adjustments, and deviation from AST phases to adjust to specific project needs, to support continuous process improvement and an ultimate successful delivery.
Root cause analysis is a popular area that has been researched and written about a great deal. What we present here is our approach to implementing it. For more information on root cause analysis and a sample template, review the SixSigma discussion on "Final Solution via Root Cause Analysis (with a Template)." [8]
Summary
To assure AST program success, the AST goals need to be not only defined but also constantly tracked. Defect prevention, AST and other software testing metrics, and root causes analysis implementation are important steps to help prevent, detect, and solve process issues and SUT defects. With the help of these steps the health, quality, and progress of an AST effort can be tracked. These activities can also be used to evaluate past performance, current status, and future trends. Good metrics are objective, measurable, meaningful, and simple, and they have easily obtainable data. Traditional software testing metrics used in software quality engineering can be applied and adapted to AST programs. Some metrics specific to automated testing are
- Percent automatable
- Automation progress
- Percent of automated testing coverage
- Software automation ROI (see IAST for more details)
- Automated test effectiveness (related to ROI)
Evaluate the metrics outcome and adjust accordingly.
Track budgets, schedules, and all AST program-related activities to ensure that your plans will be implemented successfully. Take advantage of peer reviews and inspections, activities that have been proven useful in defect prevention.
As covered in IAST, in the test case requirements-gathering phase of your automation effort, evaluate whether it makes sense to automate or not. Given the set of automatable test cases, determine which ones would provide the biggest ROI. Consider that just because a test is automatable doesn't necessary mean it should be automated. Using this strategy for determining what to automate, you are well on your way to AST success.
References:
- E. Dustin, "The People Problem," www.stpmag.com/issues/stp-2006-04.pdf; "The Schedule Problem," www.stpmag.com/issues/stp-2006-05.pdf; and "The Processes and Budget Problem," www.stpmag.com/issues/stp-2006-06.pdf.
- https://www.thefreedictionary.com/metric
- Adapted from Dustin et al., Automated Software Testing
- Stephen H. Kan, Metrics and Models in Software Quality Engineering, 2nd ed. (Addison-Wesley, 2003).
- Adapted from Teknologika blog "Software Development Metrics Defect Tracking"
- C. Jones, keynote address, Fifth International Conference on Software Quality, Austin, TX, 1995.
- Adapted from Dustin et al., Automated Software Testing.
- https://www.isixsigma.com/tools-templates/cause-effect/final-solution-root-cause-analysis-template/
More Software Testing Metrics Articles
Practical Experience in Automated Testing
Test Automation Strategy Out of the Garage
An Agile Tool Selection Strategy for Web Testing Tools
Defining Test Automation Metrics
More Software Testing Knowledge
Software Testing Videos and Tutorials
Click here to view the complete list of archived articles
This article was originally published in the Fall 2009 issue of Methods & Tools
|
Methods & Tools Software Testing Magazine The Scrum Expert |
Copyright © by 1995-2025 Martinig & Associates |
Privacy
Follow Methods & Tools on


