|
Software Development Magazine - Project Management, Programming, Software Testing |
|
Scrum Expert - Articles, tools, videos, news and other resources on Agile, Scrum and Kanban |
PerfCake - a Lightweight Open Source Performance Testing Tool
Martin Vecera, Pavel Macik
PerfCake is an open source performance testing tool and a load generator with the aim to: 1) be minimalistic, 2) easy to use, 3) provide stable and repeatable results, 4) have minimum influence on the measured system, 5) be platform independent, 6) use component design, 7) allow high throughput.
Web Site: http://perfcake.org, @PerfCakeTool
Version tested: 7.5
System requirements: JDK 8+
License & Pricing: open source under Apache License v2.0
Support: http://perfcake.org/support/
Features of PerfCake
Lightweight
PerfCake footprint is minimal in order to minimize influence to the system under test (=SUT) function - other than communicating with it via its public interface, sending tested messages and receiving responses. The SUT should know nothing about PerfCake and so it would act as a regular client or consumer.
Stable + Deterministic = Reliable
When running the same performance scenario repeatedly against the SUT that is not changing behavior over time in a stable environment, PerfCake measures and reports the same values for metrics. Thus the results can be considered reliable and can be trusted to be used to compare various scenarios, different SUTs, environments etc. With reliable results there is no need for anything like running the performance scenarios several times and processing them statistically to get the proper picture of the performance of the SUT.
Black-box testing
PerfCake approaches the SUT as a regular client/consumer. It treats the SUT as a black-box that has known interface with known protocol and it only communicates with it through the public interface.
Various protocols
PerfCake has a pluggable architecture with many supported interfaces/protocols out of the box (HTTP, REST, JMS, JDBC, SOAP, socket, file etc.). To cover some complex scenarios, PerfCake can use different protocols to send requests and to receive responses (e.g. send via JMS and receive via HTTP).
Multiple simultaneous clients
To make sure that the SUT can handle a growing number of incoming requests, PerfCake can execute scenarios with more than one client simultaneously. It can then be useful to determine scalability and limits of the SUT in terms of concurrent incoming connections and its robustness and resistance to (D)DoS attacks.
Metrics
PerfCake supports multiple metrics such as response time, throughput or memory usage out-of-the-box. It provides also the possibility to create easily user-defined metrics.
Reporting
PerfCake is able to report partial results regularly: after specified time period, after specified number of iterations (e.g. each second, each 1000 iterations, etc.). The reporting mechanism allows for multiple metrics to be reported during a single performance scenario execution while each metric has individual regularity (e.g. report metric #1 each second and metric #2 after processing each 1000 requests, etc.).
Response validation
To confirm that the SUT works properly even under load, PerfCake is able to validate received responses. The response validation is optional and has insignificant effect on performance scenario execution, that is running a scenario with the validation enabled measures and reports the same result values as in the case when the validation is disabled.
Generated data content
PerfCake allows to send both fixed and unique messages to the SUT. It can generate the messages in a deterministic way so the performance scenario execution is reproducible.
Warm up
Support for different types of performance testing
- PerfCake is suitable for executing different types of performance tests:
- Load testing = watching the behavior of the SUT under a specified load (e.g. “What is the response time of the device while 10 concurrent clients sends 1000 requests per minute?).
- Stress testing = determining the limits of the SUT (e.g. “How many concurrent clients can the SUT handle before an error occurs?” Starting with 1 client and progressively adding more concurrent clients until the SUT stops working properly).
- Benchmarking = running a constant set of performance scenarios producing a set of results that can be used to:
- compare one SUT to another
- compare multiple scenarios or individual features of the SUT to each other
- determine one of the SUT feature’s overhead over another
- discover bottlenecks
- Soak testing = watching a behavior of the SUT under a sustained load for a long period of time, looking for hidden resource leaks.
- Scalability testing = measuring a certain metric while changing a scale factor (e.g. number of concurrent clients, number of requests per minutes, number of nodes in cluster after load balancer, etc.)
- Memory leak detection = An automated way of detecting a possible leak in the memory of the SUT.
Advanced Features of PerfCake
Maven integration
PerfCake is provided with a Maven plugin which allows running PerfCake scenario within Maven build. This makes performance test automation more easy and encourages you to run performance tests on a regular basis, for instance within your favourite continuous integration (CI) server. Running performance test on a regular basis allows you to spot performance drops very soon and thus makes it much easier to identify which commit has caused performance regression.
Capturing and replaying
With PerfCake it is possible to record raw results data from a performance test run and later replay them. This can be useful when you use a remote machine to run the test and you need to process the data on a different location or when you want to fine-tune the reporting facilities and you cannot or don't want to rerun the real test many times.
To record the test data, use a special reporter called RawReporter. This will create a single output file with the recorded data. The file can be of a significant size depending on the number of test iterations.
The file can be later replayed by providing the corresponding scenario with a different configuration of reporting section and passing the recorded data file to PerfCake in the --replay parameter.
Avoiding coordinated omission
PerfCake is well aware of a fenomena called a coordinated omission when collecting response time percentiles and histogram data often found in performance testing and compensates for it to avoid corrupting the reported results. A PerfCake’s special reporter called ResponseTimeHistogramReporter comes handy for achieving this.
Hands on PerfCake
Installation
So let's get our hands on PerfCake and start creating our first performance test.
The best way to obtain a complete distribution of PerfCake is at http://www.perfcake.org/download/. There you can find the latest stable binary release in multiple formats.
The only requirement is to have Java installed. For the best performance of PerfCake it is recommended to install Java Development Kit (JDK) as some classes are compiled dynamically during test execution. This cannot be done just with Java Runtime Environment (JRE).
Once you have downloaded your favourite build file, you can just uncompress (unzip, untar...) it in a directory you like. This is your complete installation and the location is further referenced as $PERFCAKE_HOME.
Running PerfCake
There are multiple ways of running PerfCake. If you have just downloaded and unpacked the binary distribution, you can find PerfCake’s CLI in the $PERFCAKE_HOME/bin directory. These are executables that can find your JDK and run PerfCake properly.
It is also possible to run PerfCake using a Maven plugin or its Java API.
Performance test execution in PerfCake is driven by a so called scenario. Scenarios are by default placed in $PERFCAKE_HOME/resources/scenarios. The scenario simply specifies how the load is generated, where the load/requests/messages is sent to, what the request should look like and what do you want to measure/report. You can also ask PerfCake to validate your messages or use sequences to make each request unique. These advanced concepts are described later.
At a minimum, the simplest scenario has to contain definitions for:
Generator - how the load will be generated,
Sender - where the load will be sent - interface or protocol with address, you can choose from many already implemented.
Let’s assume you need to stress test your web application that has some function exposed on the following URL: http://your-app.com/cool-app, and you need to test how fast the function is. You want to generate maximum load for 10 seconds (10000 miliseconds) with 10 simultaneous clients (working threads).
Create a file called http-echo.xml in the $PERFCAKE_HOME/resources/scenarios directory and insert the following XML snippet in it:

As you can see, the simple scenario runs for 10 seconds. It generates messages using 10 threads (by default) and sends them via HTTP to the server specified in a target element.
There are some strange constructs at a few places in the scenario in a form of ${property:default}. These are replaced by real values specified at the command line. If they are not specified, they are replaced by the default values (configured following the colon). If there is no default value and you do not pass the value at the command line, it is left intact. These properties can be used to dynamically change the behavior of the scenario without actually changing the file.
To run the scenario, we can simply invoke PerfCake using the CLI:
$ ./bin/perfcake.sh -s http-echo
The only mandatory command line argument is -s <scenario name>. To provide property values we use -property=value. That's it. Try it once more.
$ ./bin/perfcake.sh -s http-echo -Dthread.count=2
Even if you cannot see what is going on, PerfCake sends requests to your application in many threads. The test should run approximately for 10 seconds. If you want to see some numbers (e.g. how fast your system is), you have to add one more element to your scenario to evaluate the results - the reporting.
For this you have to configure a Reporter, an object that is capable of computing results in some way and publishing them wherever you can imagine.
Update your scenario by adding a reporting section:
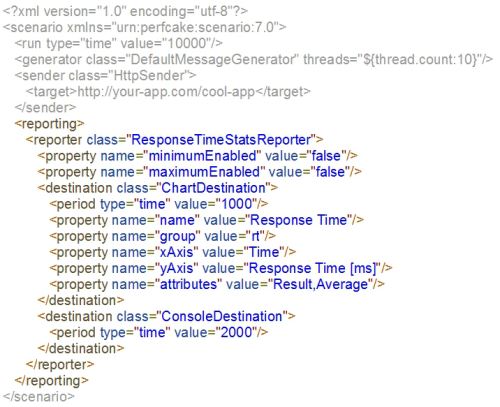
Adding the reporting section, you let your scenario to log results to some destination, in our case to PerfCake’s console and in a form of a chart. Output to the console will be provided every 2 seconds while the ChartDestination specified in the scenario produces a report with the chart similar to the following that can be found under $PERFCAKE_HOME/perfcake-charts directory.

Related Resources
- Software Testing Magazine
- Software Testing Videos and Tutorials
- Load Testing Tools and Performance Testing Software
This article was originally published in January 2018
|
Methods & Tools Software Testing Magazine The Scrum Expert |
|
Discover the best available Open Source Project Management Tools (Gantt, Scrum, Kanban) Explore a list of Free and Open Source Scrum Tools for Agile Software Project Management |
Copyright © by 1995-2025 Martinig & Associates |
Privacy
Follow Methods & Tools on


