|
Software Development Magazine - Project Management, Programming, Software Testing |
|
Scrum Expert - Articles, tools, videos, news and other resources on Agile, Scrum and Kanban |
Adaptive Project Management Using Scrum - Page 2
Craig Murphy, www.craigmurphy.com
Scrum has remarkably few artifacts. There are three artifacts, each of which can be managed using nothing more than an Excel spreadsheet. More advanced / complicated tools exist, many are expensive, web-based or are still under development. Web-based tools are great, but they are not much good if there is no "off-line" operation: I conduct much of my project management (and thinking) in airport lounges where Internet connectivity is a pay-for luxury.
Figure 1 hints at Scrum's artifacts: there is a Product Backlog and a Sprint Backlog. The Product Backlog is a prioritised list of first cut refinements. I say first cut, because the Product Owner is free to adjust the order in which Product Backlog items are development, they are even free to add new items this is the spirit of "agile".
Graphical feedback that can be printed out and displayed in a public place makes progress reporting very visible. Scrum encourages this kind of reporting and offers Burndown Charts as a means of graphically displaying a project's progress or not as the case may be. We will take a look at burndown charts later in this article.
I mentioned earlier that Scrum's artifacts can be managed by nothing more than a spreadsheet. Indeed, the Product Backlog can be represented using an Excel worksheet. Each Sprint Backlog then occupies another sheet within the same workbook.
Figure 2 presents a sample Product Backlog. Keeping with the ethos of Scrum and "agile", you shouldn't be planning more than one sprint into the future. Indeed, the contents of a Sprint are usually defined during a "Sprint planning meeting".
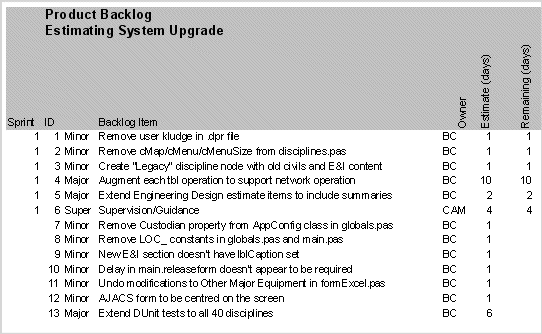
Figure 2 - A sample Product Backlog
Using the information in Figure 2, we can derive another worksheet, the Sprint Backlog (Sprint 1). Figure 3 presents a sample Sprint Backlog: it contains a list of the things that will be "done" during the Sprint. Each Sprint item has an estimate of how long it should take to complete, usually measured in hours. Looking at figure 3 again, you can see that none of the six tasks have been worked on.
During the Sprint's 30 day period, the Project Team must update the Sprint Backlog. For example, if BC spent four hours on item 1, Remove user kludge in .dpr file, on Tuesday 2nd (November in this case), he would enter '4' into Sprint day 2's Backlog item 1 column/row combination.

Figure 3 - Sprint 1 at inception
Keeping the Sprint Backlog updated is key: not only does it allow us to work out how fast a team can work (their velocity), it is an early warning indicator.
What is useful about the Sprint Backlog is its ability to be displayed graphically. Scrum uses burndown charts to represent "work done". Figure 4 presents a burndown chart where no work as been performed in the sprint. The idea behind burndown charts is that they should demonstrate a steady drive to zero hours remaining: it represents a pace of work that should be sustainable. In reality however, some work takes longer than others, and some are even shorter, so the burndown graph may not be a perfect straight line.
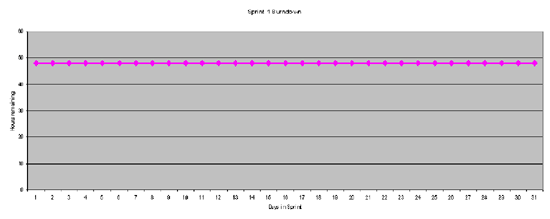
Figure 4 - Sprint Burndown, no work performed
Figure 5 presents a Sprint backlog that has been updated after work has been performed. Following the "Remove user kludge in .dpr file" item through, BC performed 4 hours work on Wednesday 3rd, followed by 2 hours work on Thursday 4th and finished the task on Friday by spending 2 hours on it.
You will also notice that on the same Wednesday, BC spent 4 hours on "Remove cMap/cMenu...". Assuming a working day of 8 hours, BC has split his time between two tasks.

Figure 5 - Sprint 1 after work has been performed
The beauty of the Sprint Backlog is its simplicity. By recording the hours of actual work completed versus the estimated hours to complete, we are able to plot equally simple, but powerful Burndown Chart that should provide you with the confidence that progress is being made. If the Burndown Chart does not indicate that progress is being made, then it has served another good purpose: it gives you an early warning that this sprint contains either too much work or too little.
Figure 6 presents a Burndown Chart based of Figure 5's Sprint Backlog. Ideally, the Burndown Chart should indicate a level velocity, i.e. work is performed at a steady rate. In reality, we need to factor in weekends and other week-day distractions. As we will see shortly, if a Project Team or individual is distracted for a few hours, Burndown Charts are a great way of identifying the distraction very early in the project.
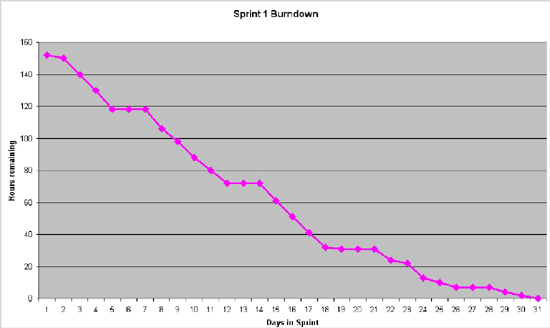
Figure 6 - Sprint Burndown after work has been performed
Figure 7 presents a burndown chart demonstrating that progress is being made, however by no means fast enough. The Burndown Chart gives us a clue that there is something wrong within 2 to 3 days of starting and confirms that work is not progressing at a good speed by days 7 through to 14.
There are a few reasons why this shape of Burndown Chart appears:
- The Project Team, or individuals are being distracted from their work
- The Sprint Backlog is not being updated
- The Sprint Backlog items are too difficult
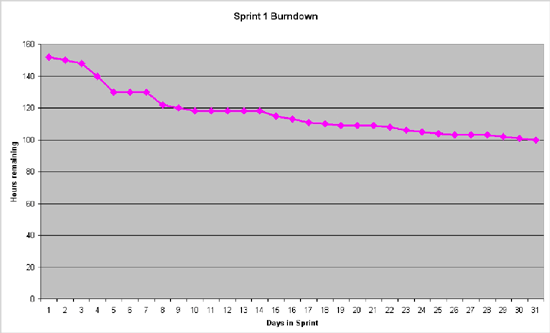
Figure 7 - Sprint Burndown after work has been performed, but not fast enough
Of course, Burndown Charts can reveal that the Sprint Backlog might finish early. For example, if a sprint does not contain enough work, you might end up with a burndown chart similar to figure 8. There are other reasons why a Sprint Backlog might appear to finish early:
Excessive working: if the Project Team works more that an 8 hour day (in this case), work might be completed "ahead of schedule". In reality, excessive working only ever appears to have short-term gain - the project will pay for it either in a loss of product quality and/or tiredness downstream resulting in loss of productivity.
Sprint Backlog item estimates may be incorrect: we may have to revisit our initial estimates as the work is being completed well within the existing estimates. This kind of exception can be caught if the Project Team know to announce the fact that the have completed a task ahead of schedule - the Sprint Backlog simply requires that a task is marked as having "0" hours remaining to indicate that it is complete.
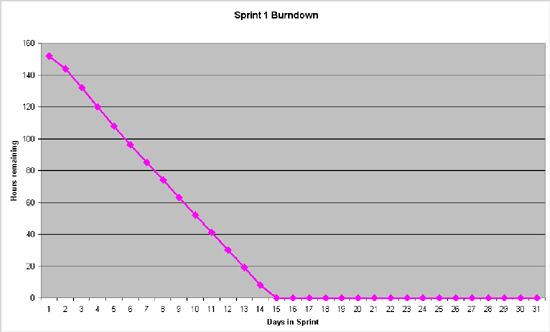
Figure 8 - Sprint Burndown after work has been performed, but too fast (not enough work)
In reality of course, we notice burndown charts that have their ups and downs whilst still meeting their target. If the ups or downs are dramatic, then alarm bells can ring indicating that something is wrong with either the sprint's scope or the sprint's Project Team. Either way, you'll get an early warning indicating that this sprint (less than 30 days of work) is about to encounter a problem. It's better to encounter and solve project issues as soon as they arise: Scrum's burndown charts put the project issues into context, better that you "lose" 30 days early in the project than you have to find time later in the project to fix mistakes made early on.
Sprint Backlogs and Burndown Charts are early warning indicators, they highlight "lack of progress". Similarly, they highlight scenarios where there is not enough work or work is too easy". However, their use does assume that everybody is committed to keeping the Sprint Backlog up to date and that is a job for the ScrumMaster.
With careful use, even these simple spreadsheets can assist in a number of other ways. For example, it is possible to extract "individual" Burndown Charts for each Project Team member. Whilst an overall Burndown Chart might highlight an overall problem with the project, using individual Project Team member Burndown Charts can help identify the one team member who is causing the problem!
Similarly, by allocating Sprint Backlog items to team members, we can respect their working time: ideally no employee should have to work more than a given number of hours per day (in this case 8).
Click here to view the complete list of archived articles
This article was originally published in the Winter 2004 issue of Methods & Tools
|
Methods & Tools Software Testing Magazine The Scrum Expert |


