|
Software Development Magazine - Project Management, Programming, Software Testing |
|
Scrum Expert - Articles, tools, videos, news and other resources on Agile, Scrum and Kanban |
Codetrack - Free .NET Performance Profiler and Execution Analyzer
Nico Van Goethem, @GoethemNico
Codetrack is a free performance profiler and execution analyzer for .NET applications. It can be used to find out where performance bottlenecks are located within your code. In contrast to other (paid) profilers, Codetrack also gives you an incredibly detailed view of the execution flow of your code. This allows you to debug your application in a post mortem scenario: you can see which method calls which and also inspect their parameters and return values. You can even track instances of objects throughout the execution flow, so if a certain object instance is used as a method argument or return value you can see this.
Web Site: www.getcodetrack.com
Twitter: https://twitter.com/Codetrack4Net (@codetrack4net)
Version tested: 1.0.1.0
System requirements: Windows with .NET FW 4.0 or higher
License & Pricing: Free for personal and commercial use (http://www.getcodetrack.com/license.html)
Support: info [at] getcodetrack.com

Installation
Codetrack is created to be used as a portable app. So no installation is required, just copy the files and you're good to go. However there is one important thing to keep in mind: make sure the codetrack files are not placed in a special folder (like 'My Documents', your desktop , a network share,...). Some processes (like IIS) don't like loading the profiling dll from such a location. I suggest using something like 'c:\temp'
Features
Wide support:
- 32 and 64 bit applications
- .NET 2, .NET 4 and up, .NET CORE
- Standalone apps, IIS, IIS express
- Windows services
Analysis:
- Detailed call information
- Performance trees per thread and combined
- Timeline view, List view, Heli view, Code view
- Search & Color Mark
- Rescope to time range(s) & Filter threads
- Timeline graph with CPU, RAM, Disk IO and heap sizes
More info about analysis: http://www.getcodetrack.com/howto_analyze.html
Non invasive:
- Attach to already running process (without restarting)
- 100% portable, just copy the files and start
- Allows for offline analysis on a different machine
Profiling modes:
- Sampling (periodic stack samples) and Tracing (every method call)
- Hi+Lo resolution, Wall time, Thread cycles, Overhead compensation
- Apply filtering before tracing (only trace what you’re interested in)
- Trace all exceptions, thread suspensions and garbage collects
- Disable inlining
- Full resolving of generics
More info about profiling modes: http://www.getcodetrack.com/profilingmodes.html
Use cases:
Codetrack can be used in different situations. The most obvious one is of course to allow you to find why your application is running slower than expected. The treeviews allow you to easily drill down to the calls that are taking the most time:
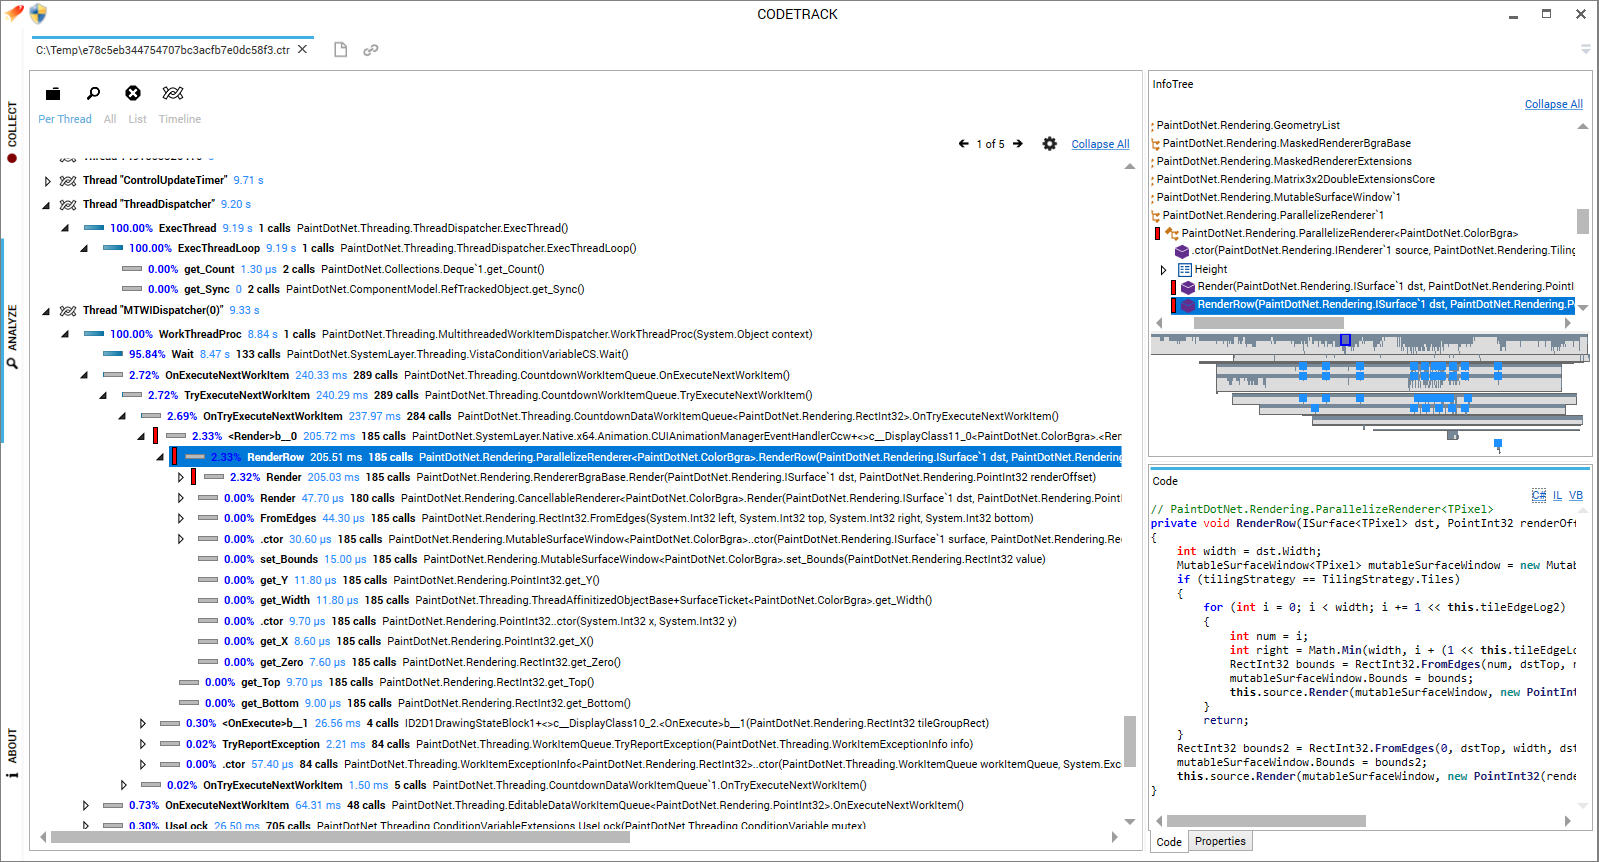
(click on figure to enlarge)
Codetrack is also extremely suitable to debug applications under circumstances where regular debuggers are not allowed (eg. production environments, clients machine,…). Sometimes it is just not possible or allowed to install a debugger or other non-portable profilers. Since Codetrack is 100% portable you can use it without leaving a trace.
Since you can also do offline analysis, it is perfectly possible to just take trace during a few minutes on a production server and then dive into all the details on your own machine.
Sometimes you change the behavior of your application by attaching a debugger (eg. when debugging the behavior of a combo box in WPF: every time a breakpoint is hit, the focus will be lost and you alter the behavior of the combo box). This can make it impossible to reproduce certain issues while analyzing what’s going on. Codetrack can also help in this situation.
Since Codetrack also decompiles the assemblies you traced, it can also be a very handy tool to see how certain applications or libraries work. You can of course do this in any other decompilation tool (like Ilspy, Justdecompile, Dotpeek,…), but these tools do not give you the flow of the execution. Codetrack gives you both, and presents the code in C#, VB or even IL.
With the unique timeline view you can zoom in onto every little detail and reveal even the shortest calls:
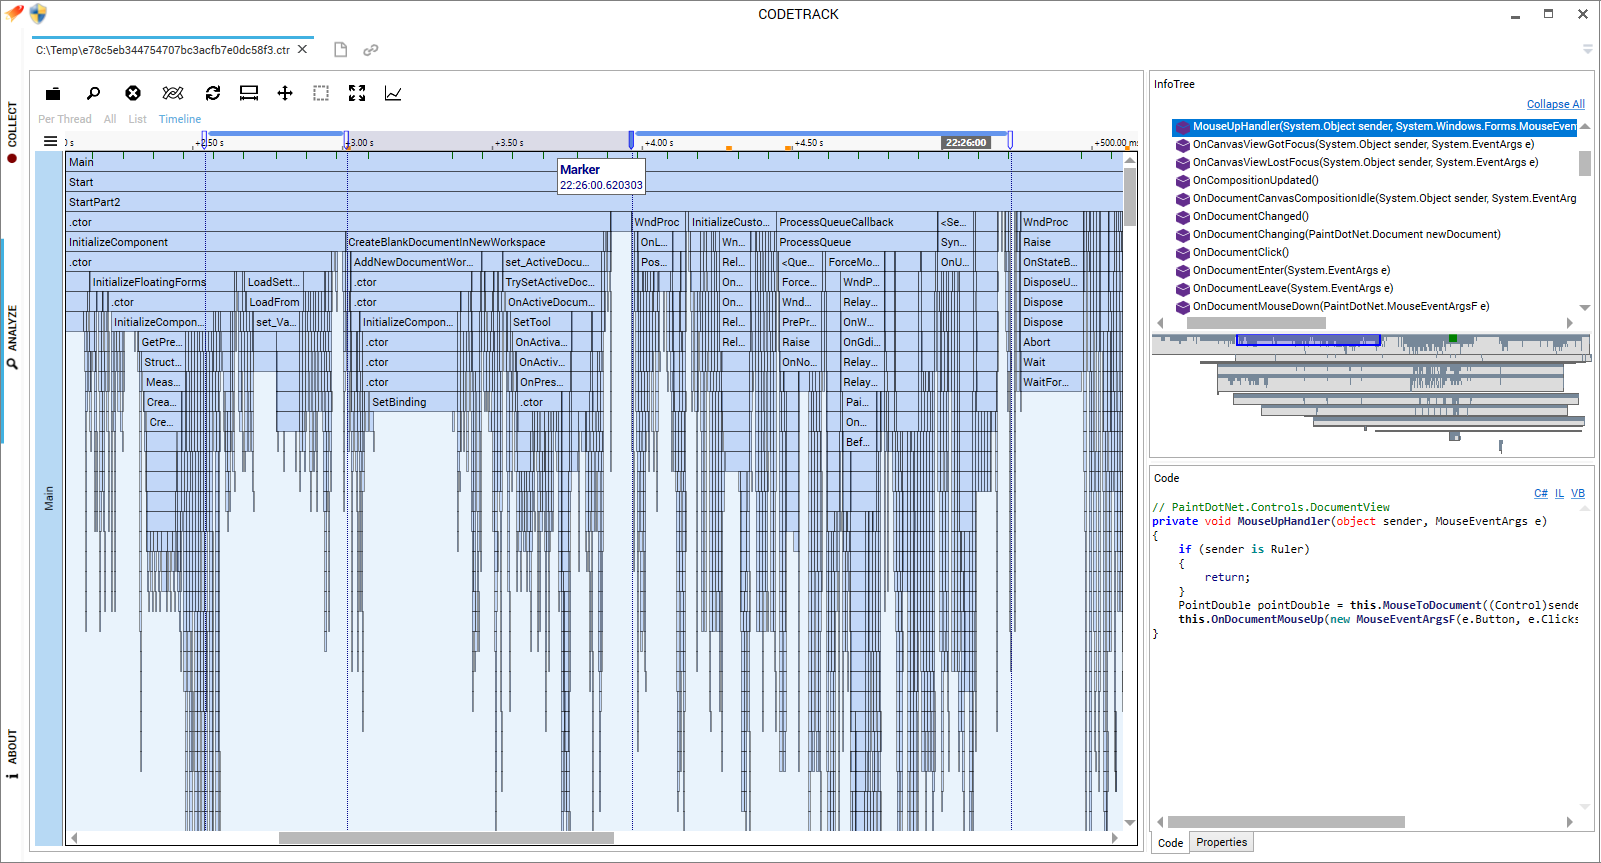
(click on figure to enlarge)
Documentation
Performance profiling can be a little overwhelming the first time, that’s why there’s lots of documentation on the website: http://www.getcodetrack.com/howto_index.html
There’s also an 8 minute video, that gives you an overview of everything you can do with Codetrack and how to take your first profiling session : https://www.youtube.com/watch?v=s9J6oq0lxwo
For any questions or issues, please don’t hesitate to drop me a mail at info [at] getcodetrack.com
This article was originally published in May 2017
|
Methods & Tools Software Testing Magazine The Scrum Expert |
|
Discover the best available Open Source Project Management Tools (Gantt, Scrum, Kanban) Explore a list of Free and Open Source Scrum Tools for Agile Software Project Management |
Copyright © by 1995-2025 Martinig & Associates |
Privacy
Follow Methods & Tools on


