|
Software Development Magazine - Project Management, Programming, Software Testing |
|
Scrum Expert - Articles, tools, videos, news and other resources on Agile, Scrum and Kanban |
Strategic Modeling for Rapid Delivery of Enterprise Architecture
Clive Finkelstein
Information Engineering Services Pty Ltd, http://www.ies.aust.com
Introduction
In this article I will discuss how a Strategic Model is developed for rapid delivery of Enterprise Architecture, based on business planning statements from Col 6 (Why) Row 2 (Owner) of the Zachman Framework for Enterprise Architecture. I will also discuss how to identify from a data model relevant business activities or processes in Col 2 (How) Row 1 (Planner). These will enable activities or processes to be prioritized so they can be used for later rapid delivery of priority systems into production, using workflow models and automatically-generated directly-executable business process management (BPM) languages such as business process execution language (BPEL). I will show how project plans and associated project maps can be derived from a data model to manage the rapid delivery of priority business activities and processes into production as systems. These project plan and project map derivation concepts have not previously been used in data modeling.
The Zachman Framework for Enterprise Architecture
Enterprise Architecture addresses the questions: "What"; "How"; "Where"; "Who"; "When"; and "Why". These questions should be capable of being answered from the different perspectives of management and staff levels in an enterprise. The details of interest to senior management - as the "Planners" and "Owners" of the enterprise - are likely to be different from the detail needed by middle managers, business experts and IT staff - as the "Designers" and the "Builders" - of the business processes and support systems that are used for financial and other reporting.
These six questions are represented by columns in a matrix, where the different perspectives of "Planner", "Owner", "Designer", "Builder" and "Subcontractor" discussed above are represented as rows. This matrix is provided by the Zachman Framework for Enterprise Architecture, as shown in figure 1. The Zachman Framework for Enterprise Architecture, developed by John Zachman, is used world-wide for the management of internal controls and alignment of information systems with business and IT resources of Government, Defense and Commercial enterprises. The Zachman Framework is the Enterprise Architecture foundation used by US Department of Defense (as DoDAF - the DoD Architecture Framework) and by US Federal Government Departments (as FEAF - the Federal Enterprise Architecture Framework). The DoDAF and FEAF are based on Enterprise Architecture, as mandated by the Clinger-Cohen Act of 1996. While Enterprise Architecture has previously been considered to be an IT responsibility, when it is also used by senior management it enables precise Governance Analysis. It also provides a Business Transformation Enablement capability.
The Designers, Builders and Subcontractors (often outsourced) work with business experts who understand the business processes of the enterprise. Based on their business knowledge, IT staff design and build systems and databases that support those processes. They provide the data, information and processing needed for day-to-day operational functioning of the enterprise. They are represented by the bottom three rows of the Zachman Framework in figure 1.
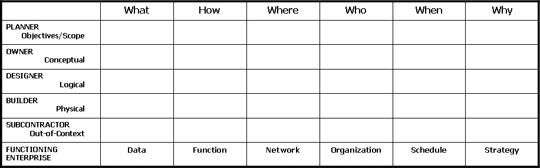
Figure 1: The Zachman Framework for Enterprise Architecture.
What is a Strategic Model?
To illustrate what a strategic model is, I will use business planning statements from the Project Management Division of a hypothetical company - XYZ Corporation - as a catalyst to identify the data and information in a strategic model needed to support management in implementing those business plans in the enterprise. I will discuss the conduct of a facilitated strategic modeling session to develop a strategic model based on the plans. I will show you how to identify from the resulting strategic model relevant business activities or processes. These can be prioritized by management so they can be used for later rapid delivery of enterprise architecture. I will show you how to derive project plans and associated project maps from a data model to manage the delivery of these priority business processes into production.
High-level views of an enterprise are shown by horizontal slices at the top of each cell of the Zachman Framework for Enterprise Architecture. This is illustrated in figure 2, now showing representative models that apply to each cell. The numbered columns indicate implementation sequence, keyed to the sequence of the numbered steps following the figure.
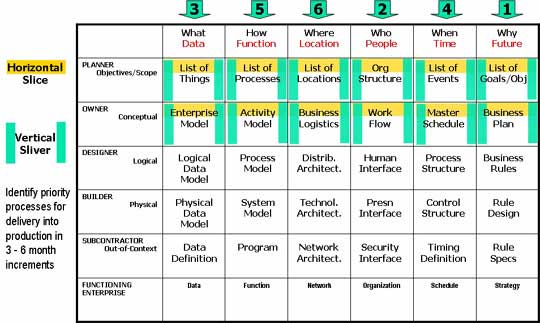
Figure2: High-level priority areas are identified as "vertical slivers" for rapid delivery
- Col 6 (Why) focuses on the business plans for the future, to understand the directions for that future.
- Col 4 (Who) identifies managers in the enterprise responsible for implementing the business plans. It identifies the staff who will help them (as business experts) to transform the enterprise for that future.
- Col 1 (What) uses the managers and business experts from Col 4 to help identify the data and information needed to support the enterprise based on its transformation plans for the future.
- Col 5 (When) identifies major business events that initiate business activities. This focus on business events based on the business plans can be used to identify reusable business activities. These can have the greatest potential transformation impact on the enterprise.
- Col 2 (How) addresses business activities identified from Col 5 and also Col 1. It defines activity models and then uses activity based costing to evaluate costs and other benefits of alternative strategies for business transformation that were defined in Col 6.
- Col 3 (Where) then addresses the locations of the enterprise to participate in this transformation.
The high-level focus of the horizontal "slice" at the top of each cell also enables priority business activities or processes to be identified as areas for transformation, that need to be implemented first. These are shown as vertical "slivers".
From the Planners' and Owners' perspectives in Rows 1 and 2 we see that vertical slivers in each cell enable greater detail to be defined in priority areas, in the sequence as numbered in figure 2. These areas progress to detailed definition. This is represented by the depth of the vertical sliver in each cell. It leads to rapid implementation using appropriate modeling tools and technologies. Thus priority business activities can be delivered into production early - before other, less important areas that can wait until later.
Figure 3: Business Plans in Col 6 (Why) are the catalyst to identify data in Col 1 (What) (click on image to see larger picture)
In terms of the Zachman Framework for Enterprise Architecture, development of the strategic model shown in figure 3 will take the following numbered steps;
- Strategic plans in Col 6, Rows 1 - 2 will be used as the input catalyst of strategic needs to transform the enterprise for the future.
- Managers and business experts are identified from the organization structure in Col 4 (Who) Row 1 (Planner) to participate in the strategic modeling facilitated session.
- Strategic modeling is used to identify "Things" of interest to the Planner in Col 1 (What), Row 1. It is used to develop a strategic model in Col 1(What), Row 2 for the Owner. This is a high-level data model that sddresses the strategic data needs for the future based on the business plans.
- Strategic business plans provide input to strategic modeling, to develop a strategic model.
Analysis of the strategic model produces an enterprise architecture portfolio plan (EAPP) for rapid delivery of priority business activities into production.
The strategic model, the EAPP and tactical business plans all provide input to more detailed tactical modeling to develop logical data models as tactical models.
The EAPP, tactical models and operational business plans also provide input to still more detailed operational modeling to develop logical data models as operational models. - Figure 4 shows that Strategic Business Plans identify Information Requirements of management and provide input to the data modeling phase as discussed following the figure.

Figure 4: A strategic model is a "picture of the business", defined using data modeling
The strategic priorities that provide input to strategic modeling are identified as follows:
- The strategic plans in Col 6 (Why) are related to parts of the enterprise by using a matrix of planning statements related to the organization structure (Statement - Organization Matrix).
- The Statement - Organization Matrix uses the organization structure in Col 4 (Who), Row 1 (Planner) to identify key managers who are responsible for various statements in the strategic plan in Col 6 (Why).
- These key managers and their business experts participate in the facilitated modelling session (covered next) to develop the strategic model in Col 1 (What), Rows 1 - 2.
- Data modeling is used to develop a strategic model from strategic plans for the rapid development of high-level business data models. These data models will be used to derive project plans for high-priority business activities and processes, to deliver high-Return-on-Investment systems early.
Data modelling helps identify alternatives, leading to business benefits. This provides business justification for technology alternatives and funding approval for the technology and resources for implementation.
The enterprise architecture portfolio plan (EAPP) is a deliverable from strategic modeling and is based on entity dependency analysis, which I will discuss shortly. This establishes clear project plans for priority projects. It leads to detailed development of approved projects. Tactical and operational data models define data bases for rapid implementation, and define metadata for XML repositories, web services and Service-Oriented Architecture (SOA) as I will cover in later articles.
I will now discuss the business planning statements that I will use as catalysts for an example strategic modeling facilitated session. The following statements are for XYZ Corporation, whose corporate mission is as follows:
"Mission of XYZ Corporation: We supply products and services to address the needs of our customers, wherever they are located. On their behalf we will research and source the most appropriate products from the world's leading suppliers. We are skilled and dedicated people working with our customers to satisfy their needs and expectations for our long term mutual benefit. We will provide exceptional service and value so that we will always be their first choice. We will increase the value of our Company and also improve the economic well-being and quality of life of our stakeholders: customers, suppliers and staff."
Effectively, XYZ acts as a broker for its customers, locating suppliers that provide the products and services that they need. I will use planning statements from the Project Management Division of XYZ Corporation. As an experienced project manager, you can therefore take the role of a business expert in the following discussion of an example facilitated strategic modeling session. These statements define the initiation and management of projects based on the following business unit mission:
"Project Management Mission: We will establish a project to manage research and sourcing of each customer's product requirements, based on their identified needs and location. For each customer project we will assess the customer based on profitability, product pricing, governance and security criteria. Based on guidelines defined with the criteria, we will research and source the most appropriate products from the world's leading suppliers."
The following statements are not intended to cover all aspects of project management. They are defined only to illustrate the application of strategic modeling principles. There are nine major policy statements in the Project Management Division business plan. To illustrate a strategic modeling facilitated session, I will use the first three policy statements as catalysts, defined by XYZ and prioritized as follows:
| 1. Project Ownership Policy | Priority |
| Each Project must have a Project Owner, responsible for allocating and managing the project budget | 1 |
| 2. Project Management Policy | |
| Each Project must have a Project Manager, responsible for completing the project by the scheduled date, within budget | 1 |
| 3. Project Authorization Policy | |
| Projects are only authorized that can achieve Project Objectives by the scheduled completion date, within budget. | 2 |
Conducting a Strategic Modeling Facilitated Session
A strategic modeling facilitated session is attended over 2 days by senior managers and business experts responsible for the XYZ Project Management Division, identified from the organization structure in Col 4 (Who) Row 1 (Planner) of figure 2.
If the enterprise architecture focus is enterprise-wide, this will of course include the senior managers of the organization. If the focus is on a particular enterprise area only - such as the Project Management Division of XYZ in this example - it will draw on senior managers and business experts of that business unit and other units that interface with it. In this discussion, you can therefore take the role of a project management business expert.
Summarizing the strategic priorities that were identified earlier in relation to figure 3:
- The strategic plans in Col 6 (Why) are related to parts of the enterprise by using a matrix of planning statements related to the organization structure (called a "Statement - Organization Matrix").
- The Statement - Organization Matrix uses the organization structure in Col 4 (Who), Row 1 (Planer) to identify key managers who are responsible for various statements in the strategic plan.
- These key managers and their business experts are used during the facilitated modelling session that follows, to develop the strategic model.
The following paragraphs describe the conduct and results of an example facilitated modeling session with these business managers and their business experts.
A facilitated strategic modeling session draws on expert business knowledge. Two days is a large amount of time for managers and business experts to allocate. It is important that all participants see the modeling session as an opportunity to identify their business needs and relevant business rules. They should not see it as a technical data modeling exercise. The session should focus on developing a "picture of the business" based on strategic plans and expert business knowledge.
The picture that is built up on a white board does not assume the business participants know anything about data modeling. Instead, any data mapping principles are presented from a business perspective only, to help in documenting the "business picture".
Unless the managers quickly see that they can directly contribute their business expertise to the evolving picture, they will consider that the session is about computers: that it is for IT staff; and not for them. At the first rest or coffee break they will disappear back to their offices with urgent duties they must attend to. If this happens, you will not get them back. You will have lost an opportunity to get them actively involved. This opportunity may not easily present itself again. The result will be that your enterprise architecture initiative will become a typical IT project. It will be limited - as for most IT projects - by the difficulty in determining the business requirements.
As we develop the business picture in the following pages you will see that the relevant data modeling and data mapping principles are introduced in a non-technical way to document the business rules that are being represented in the picture. But as it evolves as a strategic model, you will also see that it is a high-level representation of an enterprise model.
1. Project Ownership Policy
I will start with the first planning statement from the project management division of the XYZ Corporation. This is called the Project Ownership Policy:
- Each Project must have a Project Owner, responsible for allocating and managing the project budget.
The nouns in the above statement are first listed by the facilitator on the white board as shown below. You will recognize these as a "list of things" for Col 1 (What) Row 1 (Planner) as follows:
PROJECT
PROJECT OWNER
BUDGET
PROJECT BUDGET
The first two listed - PROJECT and PROJECT OWNER - are drawn as boxes on the white board. But they are NOT given the technical term "entity". Instead the facilitator explains that:
"The PROJECT box is used to represent all of the details that need to be stored about a Project. It is expressed in the singular for a single project. Many projects can exist; each can be represented in the third dimension coming out from the white board. The single PROJECT box that is drawn on the white board will therefore be used to represent all Projects. Similarly the single PROJECT OWNER box that is drawn on the white board will be used to represent all Project Owners."
This is shown in figure 5.
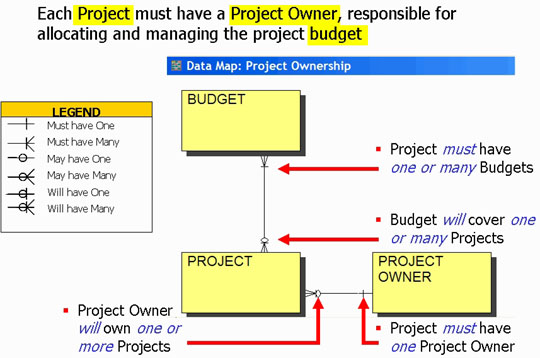
Figure 5: Strategic model fragment from the first planning statement
The facilitator asks if the PROJECT and PROJECT OWNER boxes in figure 5 are related to each other in any way. This question will be answered positively by the business audience. By drawing a line joining them, the facilitator explains that:
"This line will be used to show the business rules that are used to manage Projects and Project Owners. Lines that join boxes can also represent management controls, audit controls, security controls, governance controls, communication paths or reporting paths."
In this statement the facilitator has explained the concept of association lines in business terms, not technical terms. Next the association degree (cardinality) and the association nature at each end of the line are also defined in business terms, as business rules.
The facilitator asks if a Project can have only one Project Owner. If the response is positive, a short bar is drawn across the line close to the PROJECT OWNER box. The facilitator explains this by saying that:
"We will use this bar to represent the business rule you have just confirmed - that a Project must have only one Project Owner."
If the reply is negative and there are many apparent Project Owners, the facilitator asks if one is nominated as the "responsible owner", or if a Steering Committee acts as the responsible Project Owner. Next the question is asked for the other end of the line:
"Is a Project Owner responsible for only one Project, or for one or many Projects?"
If the audience response is "many projects", by holding up three fingers the facilitator introduces the concept of the crow's foot symbol to represent one or many, with a single finger representing one. The crow's foot symbol is added to the end of the line touching the PROJECT box, pointing out that:
"The one symbol (the absence of a crow's foot) already touches the PROJECT OWNER box based on the earlier business rule that you defined."
The next question determines the association nature at the PROJECT end of the line, by asking:
"May a Project Owner have no projects at any time?"
For a positive reply, the facilitator adds a zero to the many symbol saying:
"This represents the business rule that a Project Owner may own zero, one or many Projects at any time."
On a positive response to: "must a Project Owner have at least one project at any time?" a short bar is instead added to the many symbol saying:
"This represents the business rule that a Project Owner must own at least one or many Projects at any time."
Finally, on a positive response to: "will a Project Owner eventually have at least one or many projects?" a short bar and zero are both added to the many symbol saying:
"This shows the business rule that a Project Owner will eventually own one or many Projects" (see Legend in figure 5.)
Figure 5 shows the result so far, with PROJECT and PROJECT OWNER documented on the white board and the business rules notation discussed above shown in the legend. The business rules that have been agreed by the audience have been written for each end of the line. This is an initial fragment of the strategic model that will eventually be developed for Col 1 (What) Row 2 (Owner).
We will discuss the addition of BUDGET and its relevant notation in figure 6.

Figure 6 Strategic model fragment with BUDGET added
Referring now back to the list of nouns, BUDGET is added to the white board. On confirmation (from the facilitated modeling session audience) of the business rule that "Projects have Budgets", a line is used to join these two boxes. The relevant business rule questions above are now asked at each end of the line between BUDGET and PROJECT, with the results added to the white board to show that "a Project must have one or many Budgets" and "a Budget will cover one or many Projects" (see figure 5). It is useful also to have a legend of the association degree and nature symbol meanings prominently displayed in the facilitated session, as in figure 5.
Referring now to figure 6, the facilitator explains in business terms that:
"It is hard to see from this business picture which Budgets relate to which Projects. We need to make this clearer by adding another box between these two boxes. This new box is typically named by combining both words - as PROJECT BUDGET. In fact the policy statement that we started with did refer to Project Budgets, although this does not always happen in such a convenient way."
The result of this decomposition is shown in figure 7.
The facilitator confirms again the business rules for each crow's foot (many) that touches PROJECT BUDGET, as well as the mandatory one rule (must) touching each of PROJECT and BUDGET. These are verbally expressed using business terminology as business rules; technical data mapping terminology should not be used.
Notice that PROJECT BUDGET has been arrowed in figure 7 to show it represents the Project Budget Management Activity. The facilitator explains this principle in business terms by saying, that:
"Whenever we decompose a many to many association in this way, we are also focusing on the underlying business activity or business processes that are represented by the intermediate box."
This is a principle that is not generally understood by experienced data modelers, who typically leave many-to-many associations in an enterprise model. This squanders opportunities to discuss the business meaning of the business activities or processes uncovered by decomposing many-to-many associations as illustrated in figure 7.
In business terms, the facilitator has now also introduced the main concepts of business-driven data mapping. By using non-technical terms, the managers and business experts in the audience now understand that:
- Boxes are data entities that are stored during implementation for later reference as data base tables.
- Lines joining related boxes are used to represent management controls, audit controls, governance controls, security controls, communication paths and reporting paths. These lines are called associations.
- Symbols on a line touching a box represent business rules that apply to the two boxes joined by the line. They are called association degree and nature.
- Association degree is represented by a crow's foot symbol for one or many; with no crow's foot symbol for one.
- Association nature is represented by a zero across the line for optional or may; a short bar across the line for mandatory or must; or a zero and a bar across the line for optional becoming mandatory or will.
- The result of decomposing a many to many line is the addition of an intermediate box to the picture, named from the two boxes it joins. This is called an Intersecting box.
- This intersecting box represents relevant business activities or processes, named initially by adding the suffix "Management Activity" to the intersecting box name.

Figure 7: Strategic model fragment after adding the second planning statement
2. Project Management Policy
The facilitator now moves on discuss to the second policy from the planning statements of the Project Management Division. This is a statement of the Project Management Policy.
- Each Project must have a Project Manager, responsible for completing the project by the scheduled date, within budget.
Any new nouns in the above statement are listed by the facilitator on the white board. These are potential data entities for Col 1 (What) Row 1 (Planner) as follows:
PROJECT MANAGER
The facilitator has listed PROJECT MANAGER, but not scheduled date - as this is descriptive of a PROJECT. It will likely later be identified as an attribute of PROJECT. Attributes are not shown in a strategic data map in Col 1 (What) Row 2 (Owner). They are later defined using business normalization, during more detailed logical data modeling for Col 1 (What) Row 3 (Designer).
Figure 8 now shows the addition of PROJECT MANAGER (from the second policy statement) to the evolving Strategic Model. It shows the business rules that:
"A Project Manager may be responsible for one or many Projects"; and "a Project must have a Project Manager".
In technical data mapping terminology this documents the mandatory one to optional many association between these two entities.
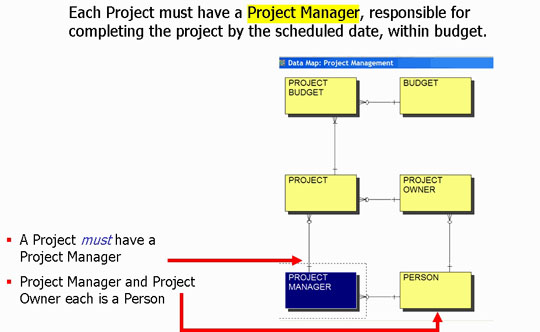
Figure 8: Strategic model fragment with the second planning statement added
Notice that PERSON has also been added in figure 8 for the two implicit business rules: "a Project Manager is a Person"; and also "a Project Owner is a Person". Similarly: "a Person may be one or many Project Managers" - most likely over time; and also "a Person may be one or many Project Owners" - again over time.
3. Project Authorization Policy
The third Project Management Division planning statement is the Project Authorization Policy.
Projects are only authorized that can achieve Project Objectives by the scheduled completion date, within budget.
New nouns in the above statement are now listed by the facilitator on the white board. These are potential data entities for Col 1 (What) Row 1 (Planner) as follows:
OBJECTIVE
PROJECT OBJECTIVE
The only new nouns are Objective and Project Objective. These two boxes are added to the business picture on the white board in figure 9. The many to many business rule between Objective and Project has already been decomposed in figure 9. The intersecting box Project Objective is explained by the facilitator as "representing the Project Objective Management Activity."

Figure 9: Strategic model fragment with the third planning statement added
Now that data mapping concepts have been introduced using business terminology and business rules, the business audience can also understand the technical data mapping terminology. Where appropriate the facilitator can now use relevant technical terms, relating the technical terminology back to the equivalent business terms. This way the business experts will be able to work actively later with data administration staff that may lapse into technical data mapping terminology from time to time.
In practice, in a facilitated modeling session the facilitator drives the session by using the relevant business statements as catalysts for discussion. Do not answer these questions yourself as facilitator based on your knowledge of data modeling. If you do, the strategic model will be viewed by the business audience as your solution; not theirs. Under no circumstances should you ever let this happen. You should only be a "mirror": acting to translate their words into a business picture. If you add your ideas to the model on the white board, they will lose interest and they will likely disappear in the next rest break.
During a live facilitated session, you will find that discussions may arise about the correct names to be used in different entity boxes. This is typically because of many synonyms that exist in most organizations. To resolve this terminology dilemma, each suggested term should be defined precisely by the audience. These definitions are unobtrusively captured by a scribe at the back of the room, using Microsoft Word (say) with a laptop computer for reference later to these definitions. Synonyms - different words that all refer to the same thing - can be discussed; a common word can then be agreed by the business audience. You will also uncover Homonyms - where the same word is used to refer to different things. Words that are unambiguous can then be agreed. These definitions are important to document, as they constitute the metadata that will later be used for implementation utilizing rapid delivery technologies based on XML, web services and Service Oriented Architecture (SOA) using BPM languages.
Deriving Project Plans using Entity Dependency Analysis
We will now discuss the steps involved in deriving project plans from the data map representing the strategic model that we have developed so far. These project plans represent the enterprise architecture portfolio to manage the rapid delivery of priority business activities or processes into production, typically in 3-month increments: derived based on the principles of entity dependency analysis.
It is important to re-emphasize the potential existence of business activities and processes that can be identified from a data map. These are based on the intersecting entities formed by decomposing many to many associations, as discussed earlier in relation to figure 7. I said then that many data modelers leave these many-to-many associations in an enterprise model. In fact, the decomposition of many-to-many associations is what constitutes the difference between an enterprise model and a strategic model. This enables the business importance of these business activities or processes to be considered by business experts and managers.
These intersecting entities are used to identify relevant activity, process or system names for Col 2 (How) Row 1 (Planner). By adding the suffix "Management", "Activity", "Process" or "System" to an intersecting entity name, the relevant Col 2 name can suggest itself, as shown in figure 10.
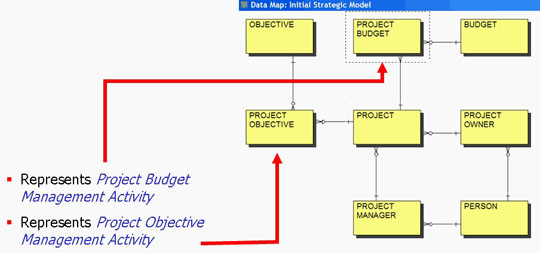
Figure 10: Business activities are identified from intersecting entities that are formed by decomposing many-to-many associations in a data map
This identification of activities, processes or systems defines the "List of Processes" for Col 2 (How) Row 1 (Planner) for prioritization by management. Priority activities or processes can then be used as vertical slivers that are sub-projects for rapid delivery of enterprise architecture, based on entity dependency analysis as discussed shortly.
The strategic model we have developed so far in figure 10 shows the existence of two activities:
- Project Budget Management Activity
- Project Objective Management Activity
Figure 11 now shows a fragment of the strategic data map for the Project Budget Management activity. Notice that a number is written close to each entity box. This indicates the sub-project phase number for the Project Budget Management activity, when that entity will be defined in detail to identify data attributes in logical data modeling for Col 1 (What) Row 3 (Designer).

Figure 11: Deriving project plans from a data map
Figure 11 shows a project plan for that activity, derived using entity dependency analysis. This project plan represents a derived sub-project for implementation, called a "cluster". It indicates a vertical sliver for potential rapid delivery, if it is a priority. A phase number precedes each entity - separated from the entity name by a right bracket. Each higher phase number is indented one position further to the right in Outline format, so it can be read as a conceptual Gantt Chart.
The derivation of the project plan shown in Outline Format in figure 11 shows a fragment of the strategic data map for the Project Budget Management activity. Notice that a number is written close to each entity box. This indicates the sub-project phase number for the Project Budget Management activity, when that entity will be defined further, to identify detailed data attributes in logical data modeling for Col 1 (What) Row 3 (Designer). This derived project plan is based on entity dependency analysis. Although the project plan in figure 11 has been automatically derived by a modeling tool, the rules and the associated entity dependency analysis steps can be also applied manually. In figure 12 each entity required by the Project Budget Management activity is now highlighted. This diagram schematically shows the required entities that are needed by the vertical sliver that represents the activity. Notice also that each of the entity names is bold. The figure 12 comment states that Project Budget Management is a common, independent activity that is reusable. We will see this reuse shortly.

Figure 12: The derived project plan identifies the data needed by the relevant activity
Figure 12 also shows the derived project plan for the highlighted entities in that activity. This project plan represents an implementation sub-project for early delivery if required. A phase number precedes each entity - separated from the entity name by a right bracket. Each higher phase number is indented one position further to the right in Outline format. It can also be read as a conceptual Gantt Chart.
An important point to make about the derivation of project plans from data models is that these derived project plan clusters precisely define "how to build" the relevant databases and processes that are to be implemented rapidly as production systems. The defined phases are used to schedule logical data modeling sessions with relevant business experts who have detailed business knowledge to help identify the required attribute detail in specific entities.
Derivation of a Project Map for Rapid Delivery
We continue our discussion of the steps involved in deriving project plans from the strategic model that has been developed so far. We will see how a project map is derived to manage the rapid delivery of priority sub-projects into production, typically in 3-month increments.
I will now analyze the data map further to identify the data entities that are required by the Project Objective Management Activity. Notice in figure 13 that the intersecting entity representing this activity has been highlighted. The project plan for this sub-project cluster is also included in figure 13.
Notice that all of the entities required by the Project Objective Management Activity sub-project cluster are highlighted in bold, as we also saw earlier. But included in the project plan we also see that BUDGET and PROJECT BUDGET (for the Project Budget Management Activity) are also included - but are NOT BOLD. The comment in figure 13 indicates that this shows that "Project Budget Management is a prerequisite reusable activity that is shared". This prerequisite sub-project dependency is more apparent in figure 14.
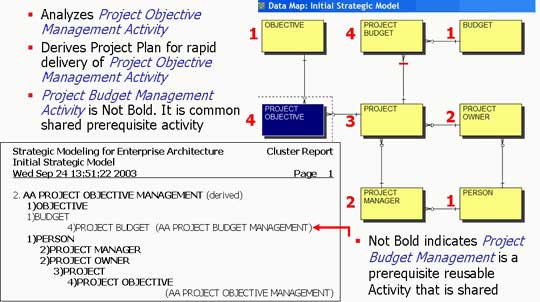
Figure 13: Derivation of project plan for project objective management
Figure 14 shows both the Project Budget Management and Project Objective Management sub-project clusters together. We can see now that the Project Budget Management activity has been reused in Project Objective Management. This reflects the mandatory business rule that a Project must have at least one or many Project Budgets. The analysis has applied this business rule to mean that Project Objectives cannot be managed effectively without also knowing the relevant Project Budget. This rule certainly is true for most enterprises.

Figure 14: Derivation of project map for rapid delivery of sub-projects
Notice the Project Map in the bottom section of figure 14. Each sub-project cluster is shown as a highlighted (shaded) box. Each box represents all entities and their phases that are contained in the relevant cluster in the top part of the figure.
The Project Map displays the Stage in a larger project when the relevant sub-project will be implemented. We can see from above that Project Budget Management is a Stage 1 sub-project; while we see that Project Objective Management is a Stage 2 sub-project. We now know the order in which each sub-project should be implemented. Project plans derived in this way are very powerful. Consider the following bulleted comments:
- The Swedish furniture manufacturer IKEA has furniture showrooms in cities throughout the world. Its furniture is sold in kit form - for "Do-It-Yourself" (DIY) construction. With the enclosed diagram and instructions, the supplied components can be assembled into the finished furniture item.
- Previously in systems development we have built systems like putting together pieces of a jigsaw puzzle - but without a jigsaw picture. We now have that jigsaw picture. This is the strategic data map; it shows us how the data entities "fit together". We also have many sub-project clusters derived from a data map, which show us the phase sequence of entities to build each sub-project.
- And we now have project maps that show us how the sub-projects can be progressively built in Stages. We now see that project maps and project plans in clusters provide the unique DIY Construction Kit that has previously been missing. These can provide a DIY Construction Kit for systems development of your enterprise.
We have now covered the main principles of strategic modeling and the derivation of project plans and project maps from a data model. These principles can be used to derive and document the Enterprise Architecture Portfolio Plan (EAPP) for any organization ... in only 20 days.
This article is based on the book "Enterprise Architecture for Integration: Rapid Delivery Methods and Technologies" (Artech House Mobile Communications Library, ISBN: 1580537138)
Chop Onions Instead of Layers in Software Architecture
A Risk-Driven Model for Agile Software Architecture
Automated Testing Strategy for a Microservices Architecture
More Software Architecture Knowledge
UMLZone.com - Unified Modeling Language (UML), Software Architecture and Data Modeling
Unified Modeling Language (UML), Software Architecture and Data Modeling Tools
Click here to view the complete list of archived articles
This article was originally published in the Spring 2007 issue of Methods & Tools
|
Methods & Tools Software Testing Magazine The Scrum Expert |
Copyright © by 1995-2025 Martinig & Associates |
Privacy
Follow Methods & Tools on


